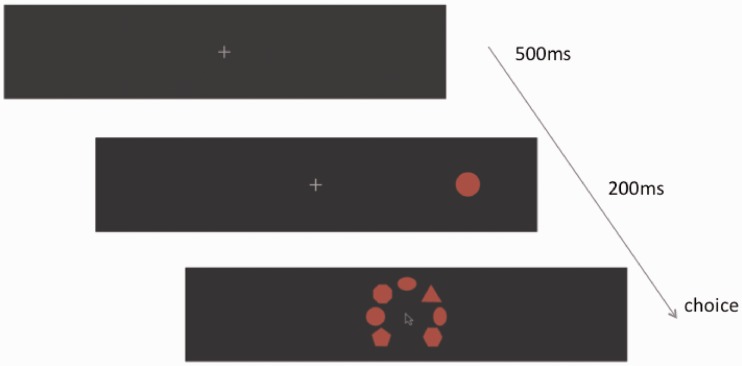
Figure 12.
A graphical illustration of the series of events for each trial. First a fixation cross was shown for 500 ms, which the participants had to look at for the trial to be valid. Then a peripheral disc was presented for 200 ms. Then a set of shapes appeared in a random order on the screen with a cursor at the center of the screen. Participants had to click on the shape they thought was the closest to what they perceived in the periphery.

