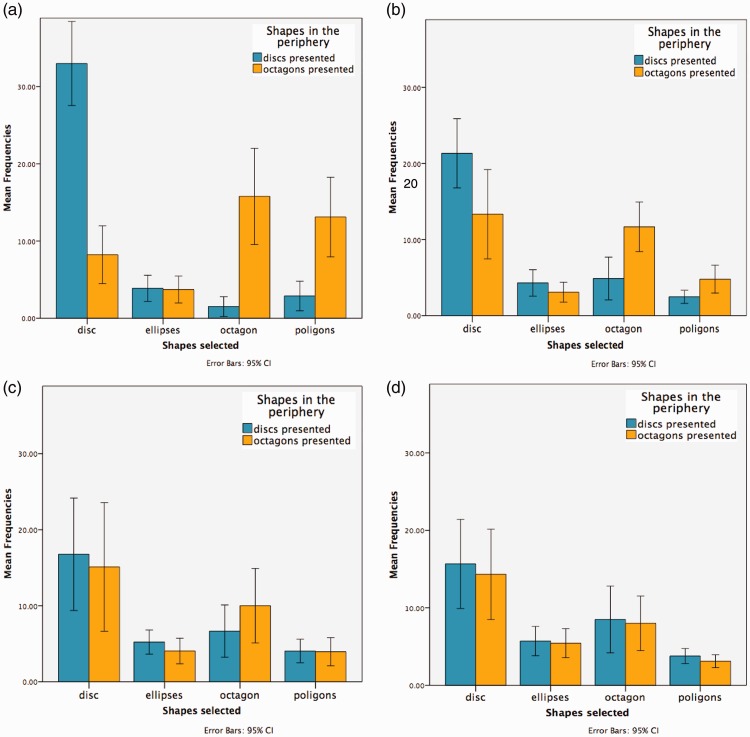
Figure 13.
These graphs show the mean frequencies of selected shapes in the condition in which discs and octagons were presented in the periphery at different eccentricities. The blue bars show the mean frequencies when discs are presented peripherally, and the orange bars show the results when octagons were presented peripherally, as a function of the selected response category: disc, octagon, ellipses (vertically and horizontally oriented), and polygons (hexagon, pentagon, and triangle). (a) 15 degrees, (b) 30 degrees, (c) 45 degrees and (d) 60 degrees.

