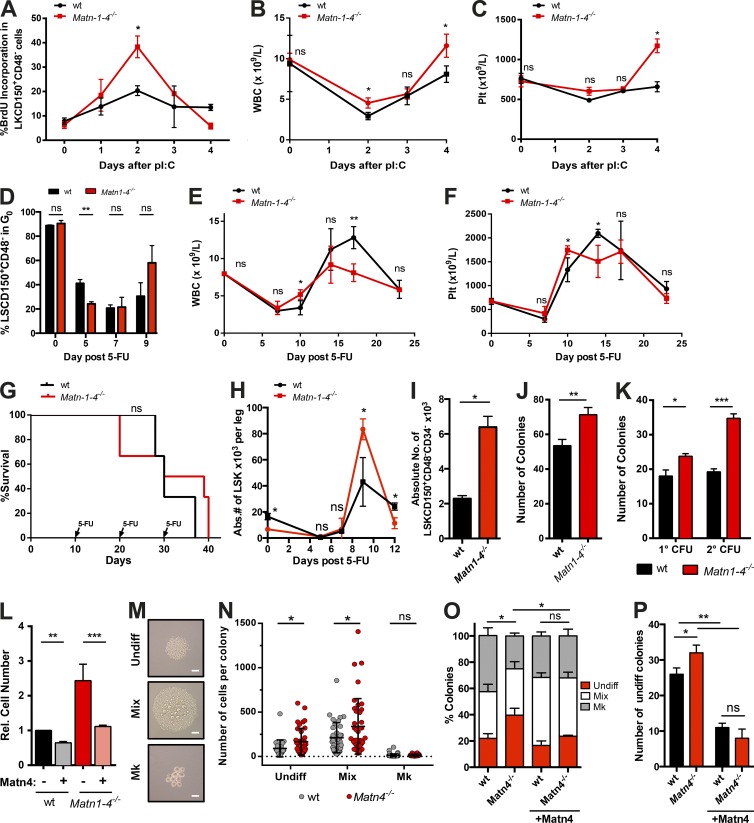
Figure 3.
Loss of Matn4 leads to increased HSC proliferation and expansion in response to stress. (A–C) BrdU incorporation (14 h) of HSCs (LKCD150+CD48−; A), WBC counts (B), and platelet (Plt) counts from WT and Matn1–4−/− mice treated with PBS (0 d) or pI:C (5 mg/kg at 1, 2, 3, or 4 d). (D) Ki67/Hoechst staining of WT and Matn1–4−/− mice was determined 0, 5, 7, or 9 d after PBS or 150 mg/kg 5-FU treatment. (E and F) WBC counts (E) and platelet counts (F) of WT and Matn1–4−/− mice, determined 0, 7, 10, 14, 17, and 24 d after 150 mg/kg 5-FU treatment. (G) Survival curve of WT and Matn1–4−/− mice treated with 150 mg/kg 5-FU every 10 d. Injection time points are indicated by arrows. n = 6 mice/group of two independent experiments. (H) Absolute number (Abs.#) of LSKs per leg 0, 5, 7, and 9 d after 150 mg/kg 5-FU treatment in WT and Matn1–4−/− mice. (I) Absolute numbers of WT and Matn1–4−/− LT-HSCs (LSKCD150+CD48−CD34−) per two femurs 9 d after 150 mg/kg 5-FU treatment. (J) On day 9 after 5-FU treatment, 2,000 sorted WT and Matn1–4−/− LSKs were seeded in CFU assay. The number of colonies was quantified on day 7. (K) WT and Matn1–4−/− LSKs were seeded in CFU assay. The number of colonies was quantified on day 7 (1°CFU), reseeded for 2°CFU, and quantified again on day 7. (L) Fold increase in WT and Matn1–4−/− cell count of the 1°CFU with or without 100 ng/ml recombinant Matn4 at day 7. Rel., relative. (M–P) Individual WT or Matn4−/− HSCs (LSKCD150+CD48−) were sorted into culture medium with or without 100 ng/ml recombinant Matn4. Colony size and types were determined on day 7 using microscopy imaging. Mk, megakaryocytes; Undiff, Undifferentiated. (M) Representative images of each colony type. Bars, 50 µm. (N) Number of cells per colony. (O) Percentage of colony types generated. (P) Number of undifferentiated colonies generated. (A–F and H–P) n = 3 mice/group. (A-P) Unless otherwise indicated, unpaired Student’s t test analysis was performed on three independent experiments for experiments. *, P < 0.05; **, P < 0.01; ***, P < 0.001. Data are mean ± SEM.

