Figure 8.
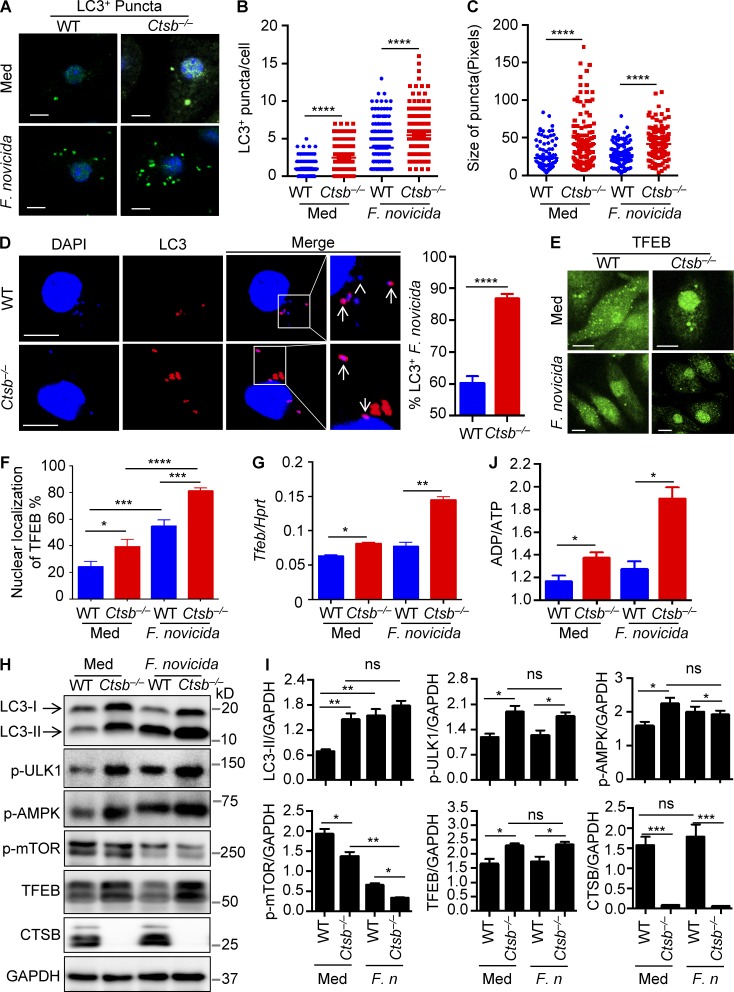
F. novicida infection induces autophagy formation and TFEB activation in macrophages. (A) Representative images of LC3-II+ puncta in uninfected (Med) WT and Ctsb−/− BMDMs or BMDMs infected with F. novicida for 4 h. (B) Quantification of the numbers of LC3-II+ puncta in WT and Ctsb−/− BMDMs with or without F. novicida infection. At least 200 cells were analyzed for each group. (C) Size of LC3-II+ puncta in WT and Ctsb−/− BMDMs in B. At least 100 cells were analyzed for each group. (D) Representative images of LC3-II+ puncta in WT and Ctsb−/− BMDMs infected with F. novicida for 4 h. Arrows indicate LC3-associated F. novicida; the arrowhead indicates LC3-II+ puncta free from F. novicida colocalization. At least 100 cells were analyzed in each group. (E) Confocal microscopy analysis of TFEB nuclear localization in WT and Ctsb−/− BMDMs with or without F. novicida infection. (F) Quantification of the percentage of TFEB nuclear localization. At least 200 cells were analyzed for each group. (G) Expression of the gene encoding TFEB was analyzed by quantitative real-time PCR. Hprt, hypoxanthine-guanine phosphoribosyltransferase. (H) Immunoblot analysis of LC3-II and TFEB and phosphorylation of ULK1, AMPK, and mTOR in uninfected WT and Ctsb−/− BMDMs or BMDMs infected with F. novicida for 3 h. (I) Quantification of the data in H. F. n, F. novicida; ns, not significant. (J) ADP to ATP ratio analysis in uninfected WT and Ctsb−/− BMDMs or BMDMs infected with F. novicida for 1 h. Data are representative of two independent experiments (A–D) or three independent experiments (E–J). Data represent means ± SEM. Bars, 10 µm. *, P < 0.05; **, P < 0.01; ***, P < 0.001; ****, P < 0.0001. ns, not significant.

