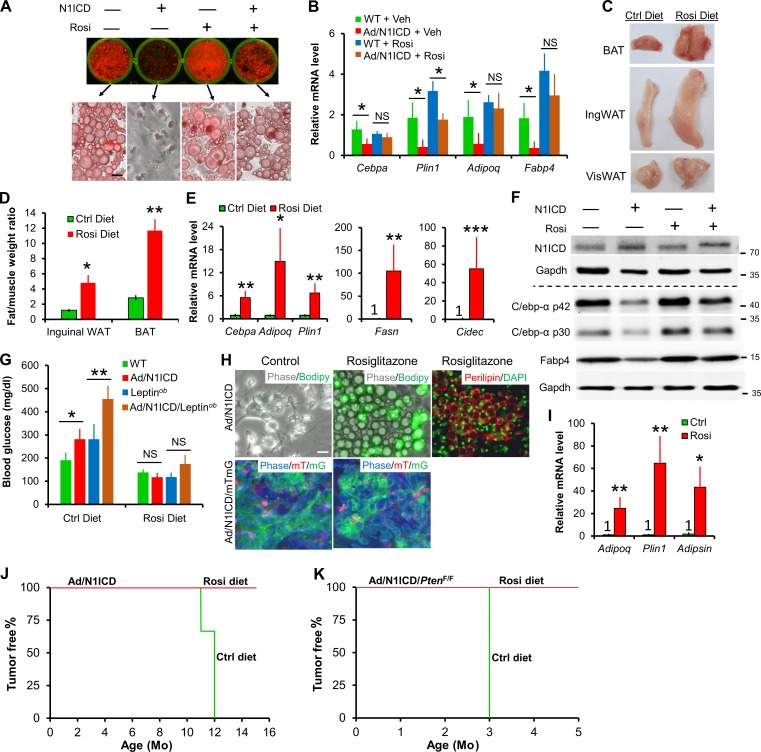
Figure 8.
Dedifferentiation of Ad/N1ICD adipocytes and LPS cancer cells is rescued by the Pparγ ligand rosiglitazone. (A) Oil-red O staining of primary adipocytes of WT and Ad/N1ICD mice with or without rosiglitazone (Rosi; 0.2 µM; n = 5). (B) Relative expression of mature adipocyte markers in primary adipocytes cultured as shown in A (n = 5). Veh, vehicle; NS, not significant. (C and D) Macroscopic images (C) and relative weights (normalized to gastrocnemius muscle; D; n = 3 pairs) of adipose tissues from Ad/N1ICD/Leptinob mice fed on control (Ctrl) diet or Rosi diet (0.005%) for 4 wk starting at 4–5 mo of age. (E and F) Relative mRNA (E) and protein (F) levels of mature adipocyte markers and lipodystrophy gene Cidec in inguinal WAT of Ad/N1ICD/Leptinob mice (n = 4). Protein marker size was labeled on right. (G) Blood glucose levels of 3-mo-old mice fed with control or Rosi diet for 1 wk (n = 5). (H) Phase and fluorescent images of cultured Ad/N1ICD or Ad/N1ICD/mTmG LPS-derived cancer cells stimulated with adipogenic cocktails. (I) Relative expression of mature adipocyte markers in Ad/N1ICD LPS-derived cancer cells as in H (n = 3). (J and K) Percentages of tumor-free mice at different ages. Ad/N1ICD and Ad/NICD/PtenF/F mice were switched to rosiglitazone diet at ∼7 mo and 21 d of age, respectively. P = 0.014 for log-rank test between Ctrl diet–fed Ad/N1ICD and Rosi-diet fed Ad/N1ICD mice; P = 0.008 for log-rank test between control-diet fed Ad/N1ICD/PtenF/F and Rosi-diet fed Ad/N1ICD/PtenF/F mice. Ad/N1ICD mice: n = 3 for control diet; n = 4 for Rosi diet. Ad/N1ICD/PtenF/F mice: n = 4 for both control diet and Rosi diet. Bar, 30 µm. *, P < 0.05; **, P < 0.01; ***, P < 0.001. Bar graphs indicate mean ± SEM.

