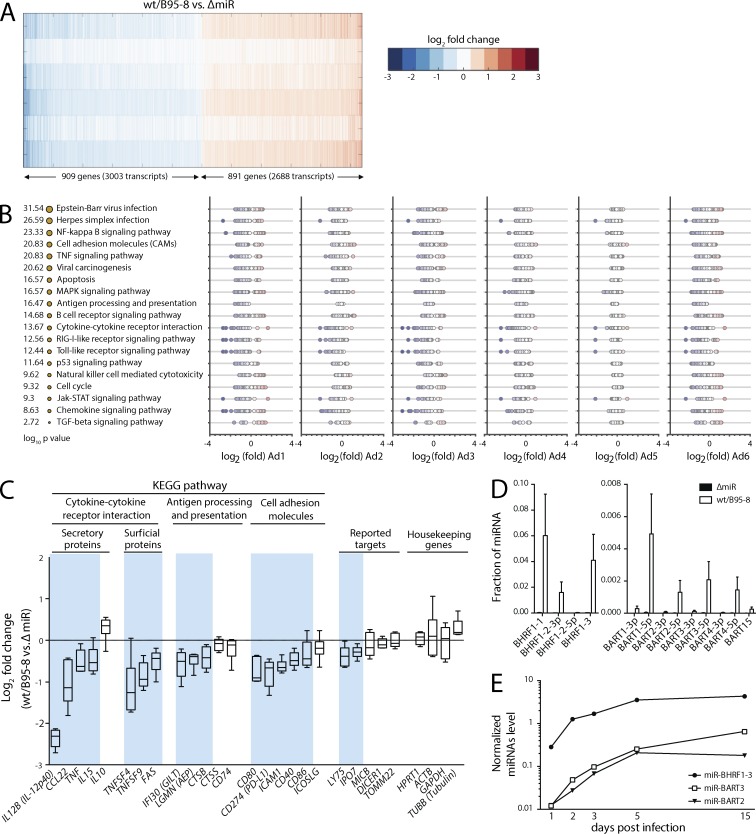
Figure 1.
EBV miRNAs affect major pathways of immunity. (A) A heat map of the most strongly regulated genes in wt/B95-8 or ΔmiR EBV–infected B cells of six donors (donor Ad1-Ad6) 5 dpi shows differentially expressed gene transcripts with absolute z-scores >1.6. Blue and red indicate down- and up-regulated transcripts, respectively, in wt/B95-8 compared with ΔmiR EBV–infected cells. (B) Shown are gene functions according to KEGG pathway categories with the identified pathways sorted by statistical significance. The sizes of the orange dots indicate −log10 P value scores. For each of the six donors, fold change values of differentially expressed transcripts are plotted. As in A, blue and red indicate down- or up-regulation by EBV miRNAs, respectively. Enrichment of specific pathways was estimated by a hypergeometric distribution test via the KEGG API Web service. (C) Inhibition of selected transcripts associated with adaptive immune responses is shown together with previously reported targets of EBV miRNAs and common housekeeping genes. Blue background shadings indicate genes down-regulated by viral miRNAs (Table S1). (D) Levels of indicated EBV miRNAs in B cells infected with wt/B95-8 or ΔmiR EBV–infected B cells of six donors (donor Ad1-Ad6) 5 dpi were quantified by RISC-IP-seq. Mean ± SD are shown. (E) Three miRNAs, which represent different primary miRNA transcripts in EBV-infected B cells, were quantified with stem-loop qPCR over time. One of two independent experiments is shown.

