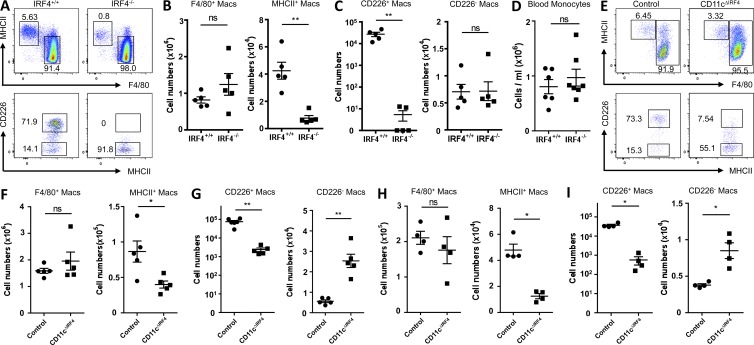
Figure 4.
IRF4 governs the development of CD226+ macrophages. (A) Flow cytometric analysis of F4/80+ ICAM2+ and MHC II+ macrophage subpopulations in IRF4+/+ and IRF4−/− mice. (B–D) Quantification of peritoneal F4/80+ macrophages and MHC II+ macrophages (B), MHC II+ macrophage subpopulations (C), and blood monocytes (D) in IRF4+/+ and IRF4−/− mice. Data are from two independent experiments (n = 5–7, mean ± SEM). P-values, unpaired Student’s t test: **, P < 0.01. (E) Flow cytometric analysis of F4/80+ ICAM2+ macrophages and MHC II+ macrophage subpopulations in peritoneal cavities of CD11cΔIRF4 mice and controls that were Cre− IRF4fl/fl littermates or age- and sex-matched Cre+ mice not bearing IRF4 floxed alleles. (F and G) Quantification of F4/80+ macrophages and MHC II+ macrophages (F) and MHC II+ macrophage CC226− or CD226+ subpopulations (G) in peritoneal cavities of CD11cΔIRF4 mice (ΔIRF4) and controls. (H and I) Quantification of F4/80+ ICAM2+ or MHC II+ macrophages (H) and MHC II+ macrophage subpopulations (I) in pleural cavities of CD11cΔIRF4 mice (ΔIRF4) and controls. (F–I) Data are representative of three independent experiments (n = 3–4 mice/experiment, mean ± SEM). P-values, unpaired Student’s t test: *, P < 0.05; **, P < 0.01.

