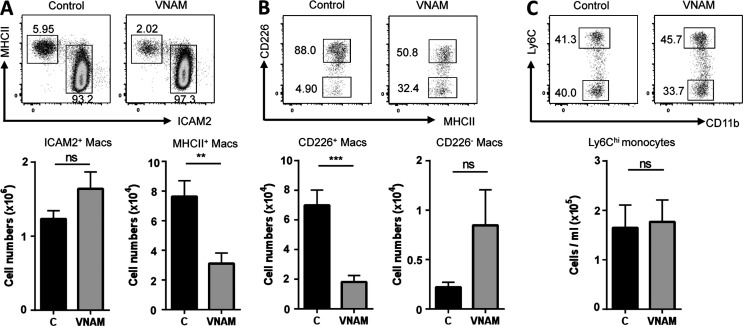
Figure 5.
Antibiotic sensitivity of CD226+ macrophages. (A and B) Flow cytometric analysis and quantification (below) of F4/80+ ICAM2+ and MHC II+ macrophages (A) or MHC II+ macrophage subpopulations (B) in the presence of antibiotic treatment (VNAM) or its absence (“C” for control group). Data are pooled from four independent experiments (n = 14–15/group, mean ± SEM). (C) Flow cytometric analysis of monocyte subpopulations and quantification (below) of Ly6Chi monocytes. Data are pooled from three independent experiments (n = 8/group, mean ± SEM). P-values, unpaired Student’s t test: **, P < 0.01; ***, P < 0.001.

