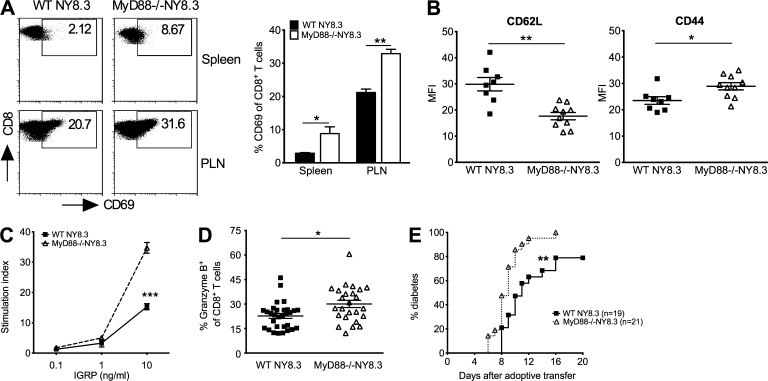
Figure 3.
MyD88 deficiency promotes highly pathogenic NY8.3 CD8+ T cells. (A) CD69 expressing CD8+ T cells in MyD88−/−NY8.3 mice. n = 4 mice/group/experiment from more than three experiments. PLN, pancreatic LN. (B) Mean fluorescence intensity (MFI) of CD62L and CD44 of gated splenic CD8+ T cells from MyD88−/−NY8.3 and WT NY8.3 mice was determined by flow cytometric analysis from three independent experiments. (C) Splenocytes from MyD88−/−NY8.3 or WT NY8.3 mice were tested upon antigen stimulation by [3H]thymidine incorporation assay. n = 3 mice/group/experiment from more than three experiments. Two-way ANOVA was used for the comparison with Bonferroni correction. (D) Granzyme B–expressing CD8+ T cells in the spleen of MyD88−/−NY8.3NOD mice stimulated by anti-CD3 and anti-CD28 followed by ICC staining. Data are from five independent experiments. (E) Diabetes incidence after adoptive transfer. 106 purified IGRP-stimulated splenic CD8+ T cells were injected i.v. into recipient NOD mice in two independent experiments. Wilcoxon test for survival was used for analysis. (A, B, and D) Two-tailed Student’s t test was used for analysis. Data are mean ± SEM. *, P < 0.05; **, P < 0.01; ***, P < 0.001.

