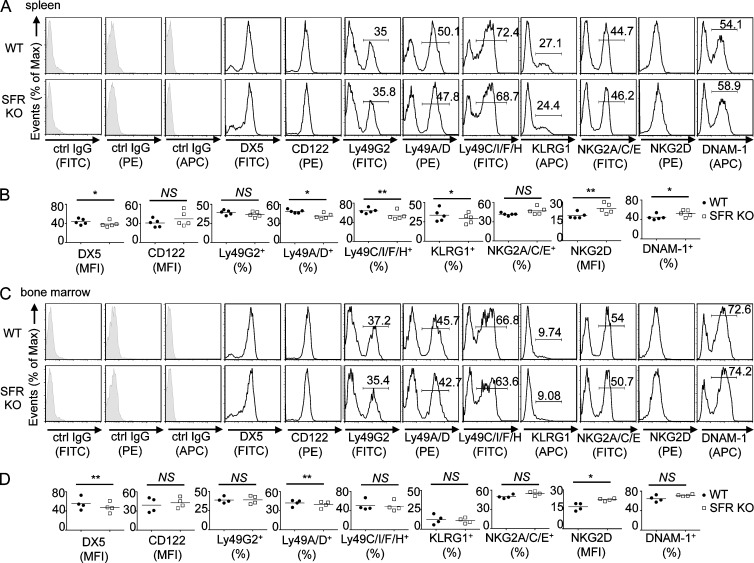
Figure 2.
Impact of Slam locus deletion on NK cell repertoire. (A–D) NK cell repertoire was analyzed by flow cytometry of NK cells (CD3−NK1.1+) from the spleen (A and B) or bone marrow (C and D) of wild-type and SFR KO mice. Isotype control (ctrl) is shown as filled histograms. Statistical analyses of mean fluorescence intensity (MFI) or percentage of positive populations from A and C are shown for multiple mice in B and D. Each symbol represents an independent mouse. *, P < 0.05; **, P < 0.01; paired Student’s t test. Data are representative of n = 5 (A and B) or n = 4 (C and D).

