Figure 3.
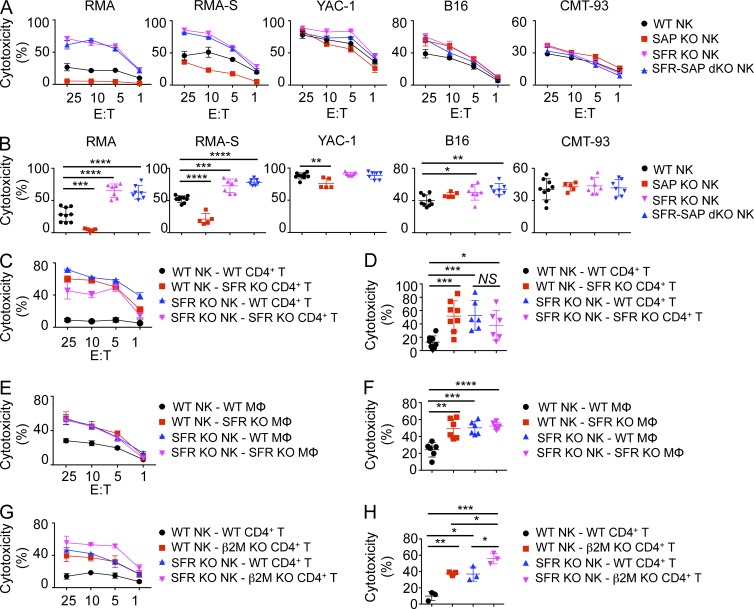
The SLAM family suppresses NK cell cytotoxicity toward hematopoietic target cells in vitro. (A) Natural cytotoxicity of IL-2–expanded NK cells purified from the spleen of wild-type, SFR KO, SAP KO, and SFR-SAP dKO mice was tested by 51Cr release assay using hematopoietic (RMA, RMA-S, and YAC-1) and nonhematopoietic (B16 and CMT-93) target cells at the indicated E/T ratio. Standard deviations of duplicates are shown by error bars. (B) Statistical analyses of results at the 25:1 E/T ratio for multiple independent experiments are shown. Each symbol represents an independent mouse. (A and B) Results are representative of at least five experiments (A) and are pooled from five experiments (B). (C and D) Natural cytotoxicity of IL-2–expanded NK cells from wild-type and SFR KO mice toward activated CD4+ T cells from wild-type or SFR KO mice was analyzed, as detailed for A and B. Each symbol represents an independent mouse. Results are representative of at least six experiments (C) and are pooled from six experiments (D). (E and F) Natural cytotoxicity of IL-2–expanded NK cells from wild-type and SFR KO mice toward bone marrow–derived macrophages (MΦ) from wild-type or SFR KO mice was tested, as detailed for A and B. Each symbol represents an independent mouse. Results are representative of six experiments (E) and are pooled from six experiments (F). (G and H) Natural cytotoxicity of IL-2–expanded NK cells from wild-type and SFR KO mice toward activated CD4+ T cells from wild-type or β2M KO mice was tested, as detailed for A and B. Each symbol represents an independent mouse. Results are representative of three experiments (G) and are pooled from three experiments (H). (C, E, and G) Mean values with standard deviations are depicted. *, P < 0.05; **, P < 0.01; ***, P < 0.001; ****, P < 0.0001; unpaired Student’s t test.

