Figure 4.
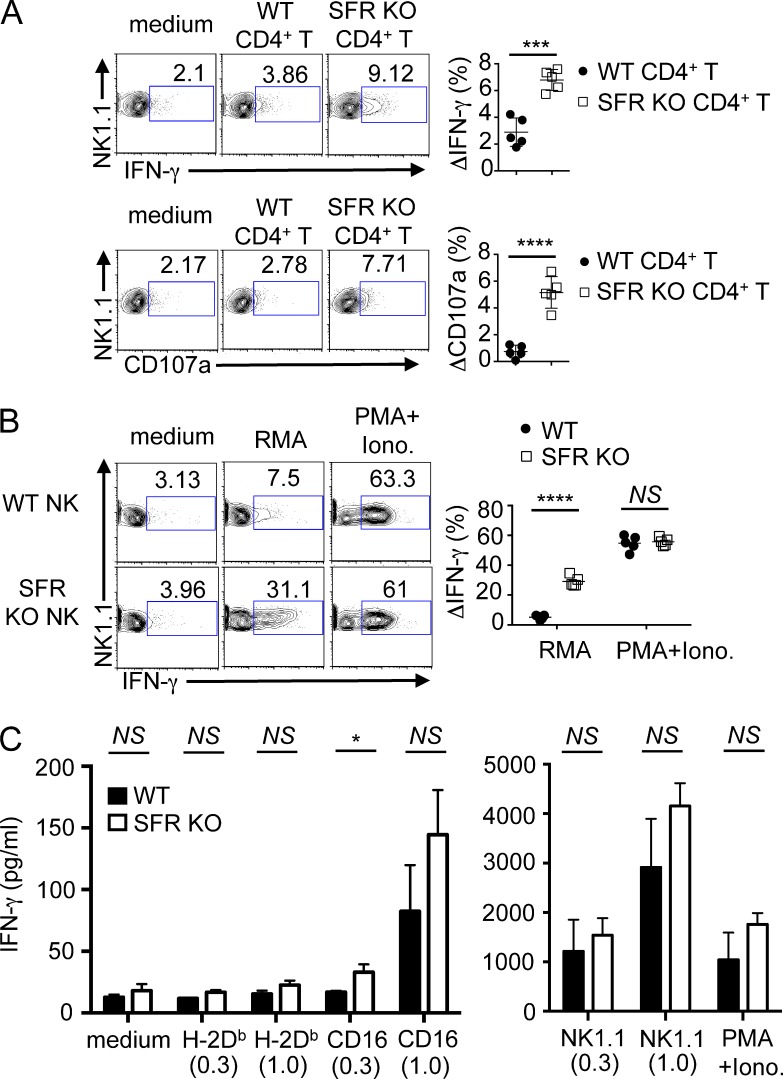
The SLAM family suppresses NK cell–mediated cytokine production in response to hematopoietic target cells in vitro. (A) Splenocytes from wild-type mice were cultured with IL-2 for 1.5 d and then incubated for 4 h with medium alone, activated wild-type CD4+ T cells, or activated SFR KO CD4+ T cells. IFN-γ production was detected by intracellular staining (top), whereas degranulation was determined by surface staining of CD107a (bottom). NK cells were gated on CD3−NK1.1+. IFN-γ–producing or CD107a+ cells are boxed, and percentages are represented above each box. (Left) Representative experiments are shown. (Right) The increase in the percentage of IFN-γ–producing (ΔIFN-γ) or CD107a+ (ΔCD107a) cells between NK cells stimulated with medium alone or the indicated target for multiple independent mice is represented. Each symbol represents an independent mouse. Results are representative of five experiments. (B) Splenocytes from either wild-type or SFR KO mice were cultured in IL-2–containing medium for 1.5 d and then incubated with medium alone, RMA cells, or PMA + ionomycin (Iono.) for 4 h. IFN-γ production was detected by intracellular staining, as detailed for A. (Left) A representative experiment is shown. (Right) The increase in the percentage of IFN-γ–producing cells between NK cells stimulated with medium alone or the indicated stimulus for multiple independent mice is represented. Each symbol represents an independent mouse. Results are representative of five experiments. (C) Wild-type or SFR KO NK cells were expanded in IL-2 and stimulated for 24 h with the indicated concentrations (in µg/ml) of plate-bound antibodies against CD16, NKRp1c (NK1.1), or class I MHC (H-2Db). Cells were also stimulated with PMA and ionomycin. Secretion of IFN-γ was monitored by ELISA. Assays were done in duplicate and mean values of duplicates were used for statistical analyses. Data from three independent mice are included. Mean values for the three mice with standard deviations are depicted. Results are representative of two experiments with a total of five mice. *, P < 0.05; ***, P < 0.001; ****, P < 0.0001; unpaired Student’s t test.

