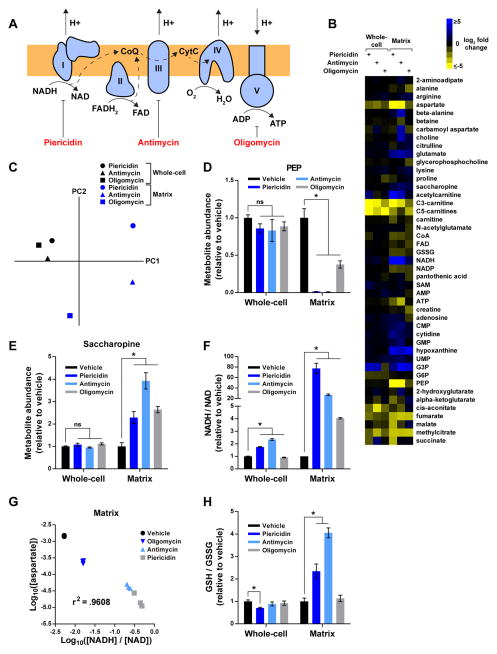
Figure 3. see also Table S2: The compartmentalized dynamics of matrix metabolites during RC dysfunction.
(A) Schematic depicting the function of each RC component and the corresponding sites of inhibition for piericidin, antimycin, and oligomycin. Complexes I–IV transfer high- energy reducing equivalents from NADH and FADH2 to O2, generating a proton gradient in the process. Complex V utilizes this gradient to synthesize ATP. CoQ, coenzyme Q; CytC, cytochrome C.
(B) Heat map representing changes in metabolite concentrations upon inhibition of Complex I, III, or V, as assessed by whole-cell and mitochondrial metabolomics. For each metabolite and inhibitor, the mean log2-transformed fold change is relative to the corresponding whole-cell or matrix concentration of vehicle-treated cells (n = 3). To be included in the heat map, metabolites had to change at least 2-fold upon inhibition of an RC complex. See Table S2 for additional criteria used to generate this heat map and for the concentrations of all metabolites.
(C) Whole-cell and matrix profiles during RC dysfunction are substantially different. Principal component analysis of metabolite changes in Figure 3B as assessed by profiling of the mitochondrial matrix (blue) or whole-cells (black).
(D) RC inhibition lowers matrix PEP.
(E) RC inhibition increases matrix saccharopine.
(F) The NADH/NAD imbalance during RC dysfunction is more pronounced in the matrix than on the whole-cell level.
(G) The relationship between matrix aspartate and the matrix NADH/NAD ratio can be modeled as a power function. Log10-transformed values of matrix aspartate concentrations (units of M) and NADH/NAD ratios were compared across different states of RC function and a Pearson correlation coefficient was calculated.
(H) Inhibition of Complexes I and III increases matrix GSH/GSSG ratios. For all panels, unless indicated otherwise, all experiments were performed in DMEM without pyruvate and all measurements are normalized to the corresponding whole-cell or matrix concentrations of vehicle-treated cells (mean ± SEM, n = 3, *p < 0.05).

