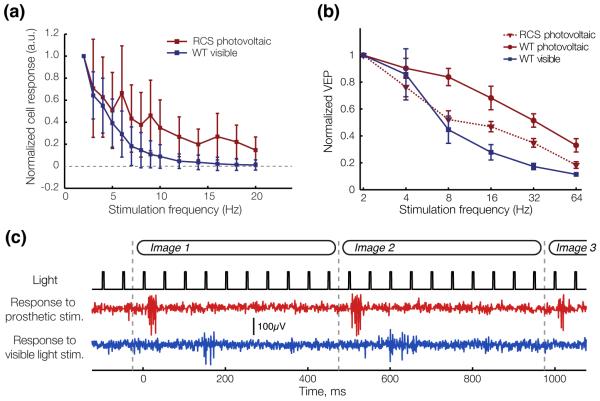
Figure 11. RGC and cortical adaptation to high frequency stimulation.
(a) Average steady-state response of RGCs to pulsed stimulation of varying frequency in arbitrary units (a.u.). Error bards, s.d. (b) Normalized amplitude of the VEP response to visible (WT rats) and NIR (RCS rats) stimulation pulses of increasing frequency. Error bars, s.d. (c) With 20 Hz stimulation repetition rate, RGCs respond transiently to image changes and not to every pulse of electrical current (RCS) or visible light (WT), as illustrated in the single channel voltage recordings shown here. Grey dashed lines indicate the image refresh times. Adapted from [48].

