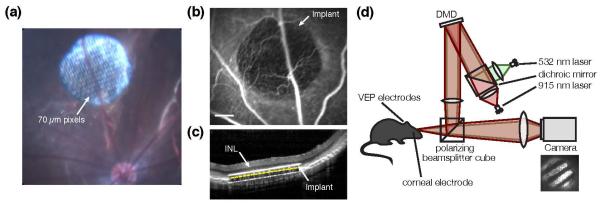
Figure 12. In-vivo evaluation of an implant.
(a) Fundus image of a subretinal photovoltaiv prosthesis with 70 μm pixels implanted in a rat eye. (b) Fluorescein angiography of a different RCS retina 1 week after implantation demonstrates normal retinal blood perfusion above the implant with no leakage. The implant is opaque to visible light and masks the choroidal fluorescence in the implanted area. Scale bar, 200 μm. (c) In an implanted RCS retina, OCT shows good preservation of the inner retina, with the inner nuclear layer (INL) located 20 μm above the upper surface of the implant (white line). The implant (30 μm in thickness) appears thicker than it actually is because of its high refractive index. The yellow dashed line illustrates the actual position of the backside of the implant, which is located on top of the retinal pigment epithelium. Horizontal and vertical scale bars, 200 μm each. (d) The in-vivo stimulation and recording system consists of a visible (532 nm) and a NIR (915 nm) laser, which illuminate a digital micromirror device (DMD). In turn, this device generates the images projected onto the retina, as shown in the photograph (inset). Projected patterns are monitored by means of a CCD camera. Adapted from [48].

