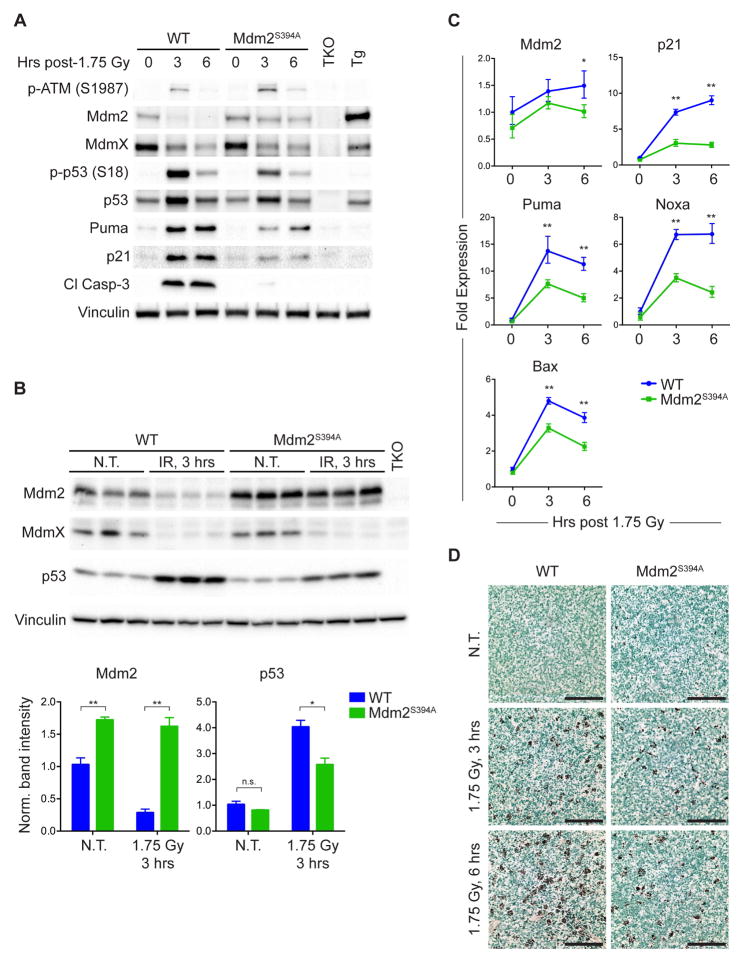
Figure 1. ATM phosphorylation of Mdm2-S394 regulates Mdm2 levels and p53 activity.
(A) WT and Mdm2S394A mice were left untreated or exposed to 1.75 Gy ionizing radiation (IR) and thymi were harvested at 3 and 6 hours. Protein levels were analyzed by western blotting. TKO indicates Mdm2−/−, MdmX−/−, p53−/− control; Tg indicates Mdm2Tg/+ Mdm2 overexpressing control.
(B) Thymus protein levels of biological triplicates of WT and Mdm2S394A mice left untreated or treated as in (A) for 3 hours, were analyzed by western blotting. Band intensities were determined by densitometry. Mdm2 and p53 levels were normalized for Vinculin levels and average values plotted (±SEM). *P < 0.05, **P < 0.01 (Student’s t-tests).
(C) Mice were treated as in (A) and fold expression of p53-target genes was determined by real-time quantitative PCR, relative to untreated WT samples using Rplp0 as internal reference (n = 3, ±SEM). *P < 0.05, **P < 0.01 (Student’s t-tests).
(D) TUNEL staining of thymi from mice treated as in (A). Scale bars represent 100 μm.

