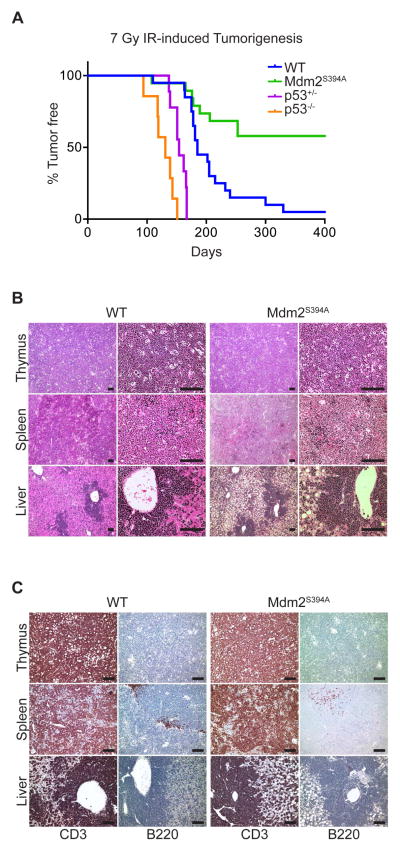
Figure 4. Mdm2S394A mice are resistant to IR-induced lymphomagenesis.
(A) Kaplan-Meier survival curves of WT (n = 20), Mdm2S394A (n = 19), p53+/− (n = 9) and p53−/− (n = 7) mice exposed to 7 Gy cumulative IR. Median survival times were as follows: WT (185 days), Mdm2S394A (n.d.), p53+/− (154 days) and p53−/− (131 days). Curves were compared by log-rank test: WT to p53−/− (P < 0.0001), WT to p53+/− (P < 0.0001), WT to Mdm2S394A (P = 0.0007), Mdm2S394A to p53+/− (P < 0.0001), Mdm2S394A to p53−/− (P < 0.0001).
(B) Representative tissue sections of lymphomas that developed in the thymus, spleen and liver of WT and Mdm2S394A mice stained with haematoxylin and eosin at 10X (left) and 40X (right) magnification. Scale bars represent 100 μm.
(C) Representative tissue sections of lymphomas that developed in the thymus, spleen and liver of WT and Mdm2S394A mice stained with antibodies specific for CD3 (left) and B220 (right). Scale bars represent 100 μm. See also Supplemental Figure S4.

