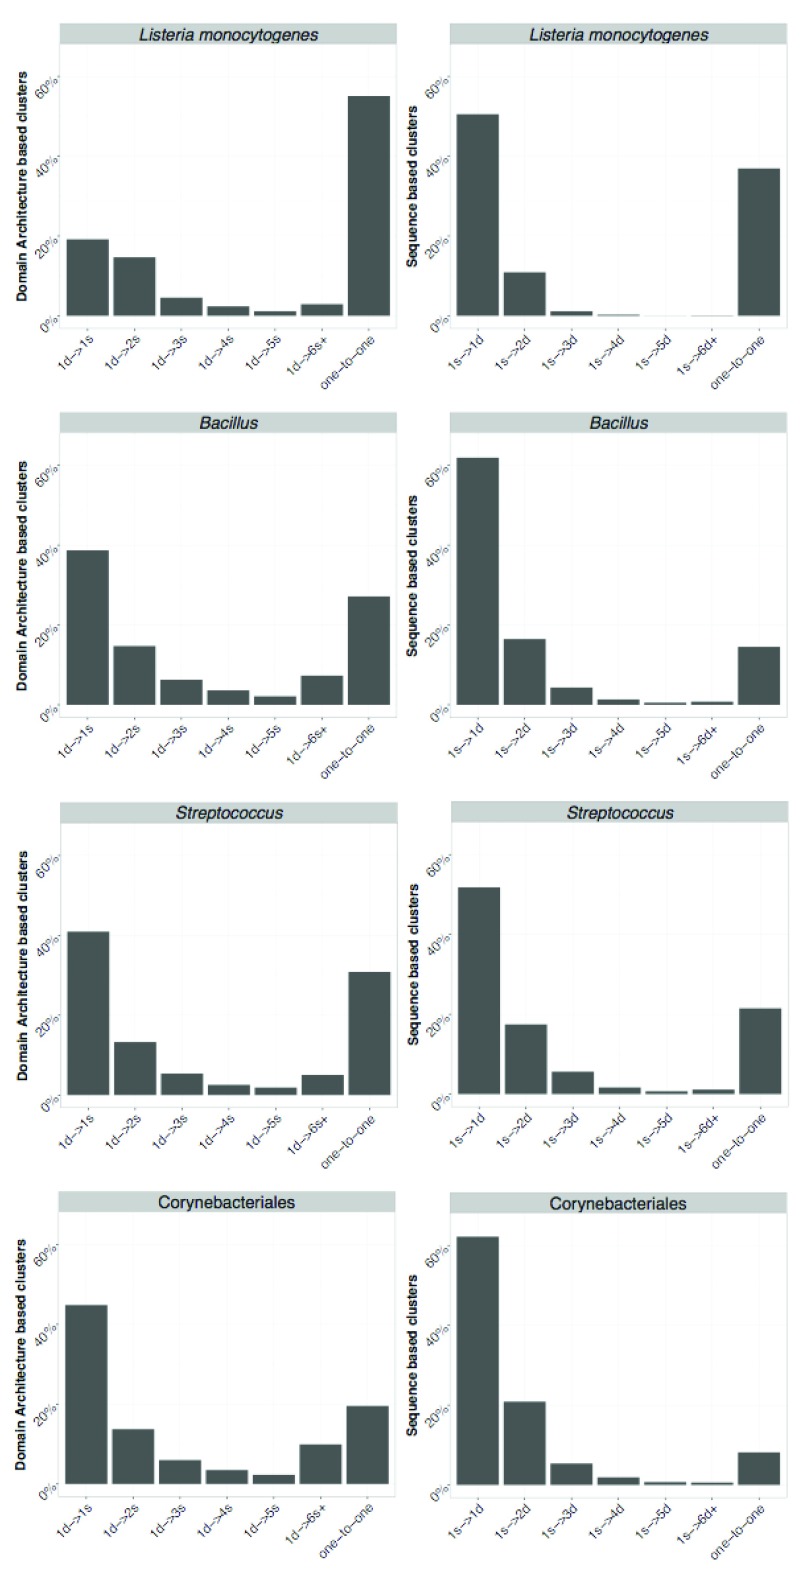
Figure 6. Comparison between DAB and SB clusters.
On the left DAB is used as a reference and each bar represents the relative frequency of one DAB cluster containing sequences assigned to {1, 2, ... , 5} and 6 or more SB clusters and one-to-one represents the relative frequency of identical cluster. Similarly, on the right SB is used as a reference. Axis labels follow notation in Figure 5.

