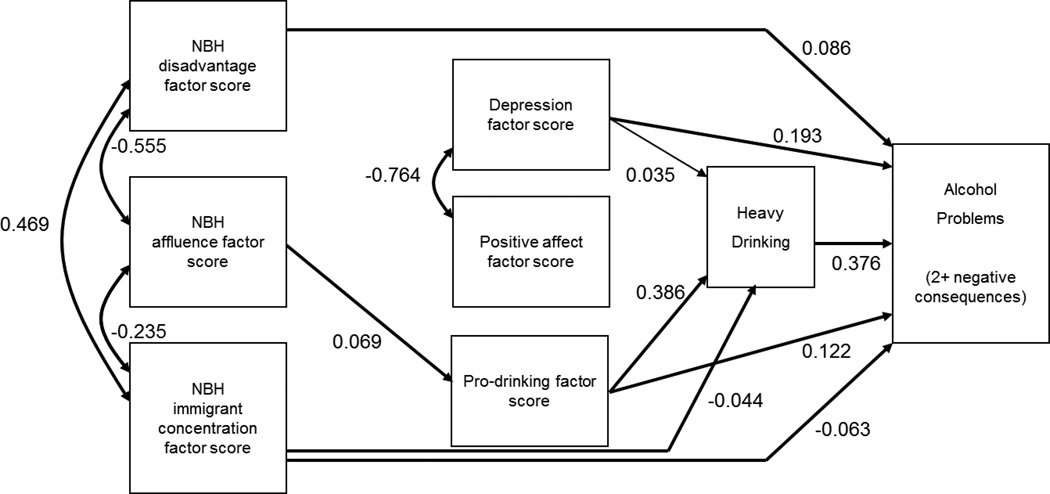
Figure 1. Standardized coefficients from reduced path model.
Notes. Model controls for age, race, gender, income, education, employment, marital status, family history of alcohol problems, and geocode precision. Non-significant paths from the control variables were trimmed to preserve degrees of freedom. Non-significant paths from neighborhood variables to mediators and alcohol outcomes not shown in this diagram. (See Table 3 for all coefficients.)

