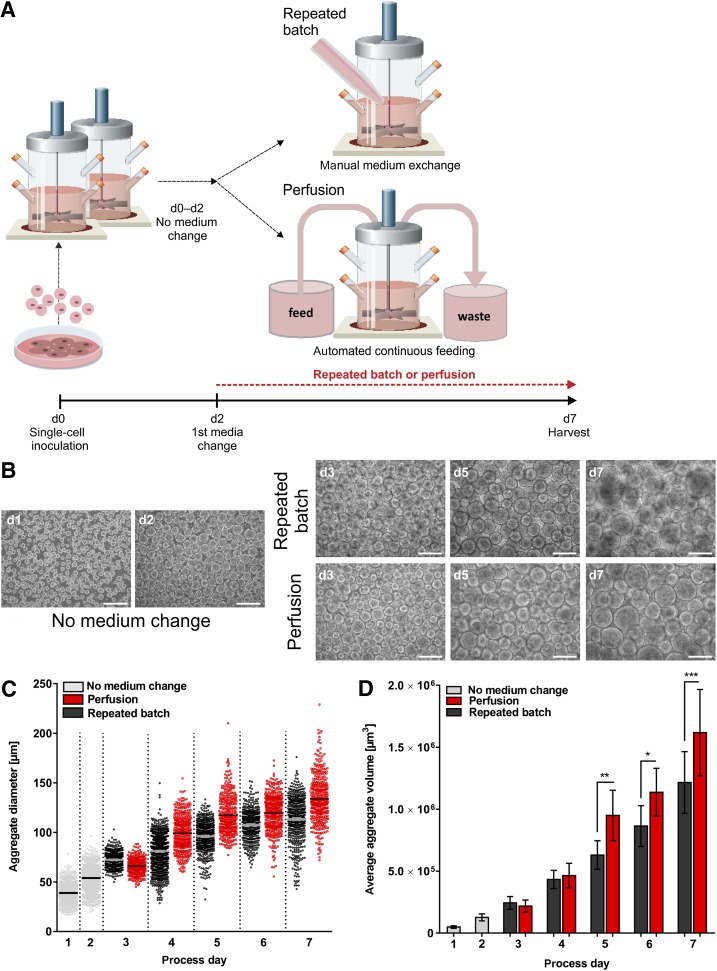
Figure 1.
Impact of feeding strategies on aggregate formation and size distribution. (A): Human induced pluripotent stem cells (hCBiPS2) were detached from monolayer cultures and seeded as single-cell suspensions on day 0 to stirred tank bioreactors. During the first 48 h cultures were maintained without any medium exchange. On culture day 2 the first complete manual medium exchange was performed for the repeated batch cultures (repeated the following days [days 3–6]), and in parallel automated continuous medium change was started for the perfusion cultures (4.2 ml/hour), resulting in equal medium throughput for both feeding strategies. On culture day 7 cells from both processes were harvested and analyzed. (B): On process days 1 and 2 (prior to perfusion start and first manual medium change in repeated batch bioreactors) as well as days 3–7 aggregates were assessed by light microscopy as shown (scale bars = 200 µm). (C): Applying AxioVision LE (Zeiss) and GraphPad prism software, between 240 and 1,480 aggregates from four independent experiments were analyzed (supplemental online Fig. 1C) from each time point and visualized as single squares. (D): The average aggregate volume calculated from the mean aggregate volume of the individual runs is depicted as columns whereby each column represents the mean of four independent bioreactor runs for each feeding strategy. Results are reported as mean ± SEM. Differences were considered statistically significant at ∗, p < .05, ∗∗, p < .01, and ∗∗∗, p < .001. Abbreviation: d, day.

