Figure 3.
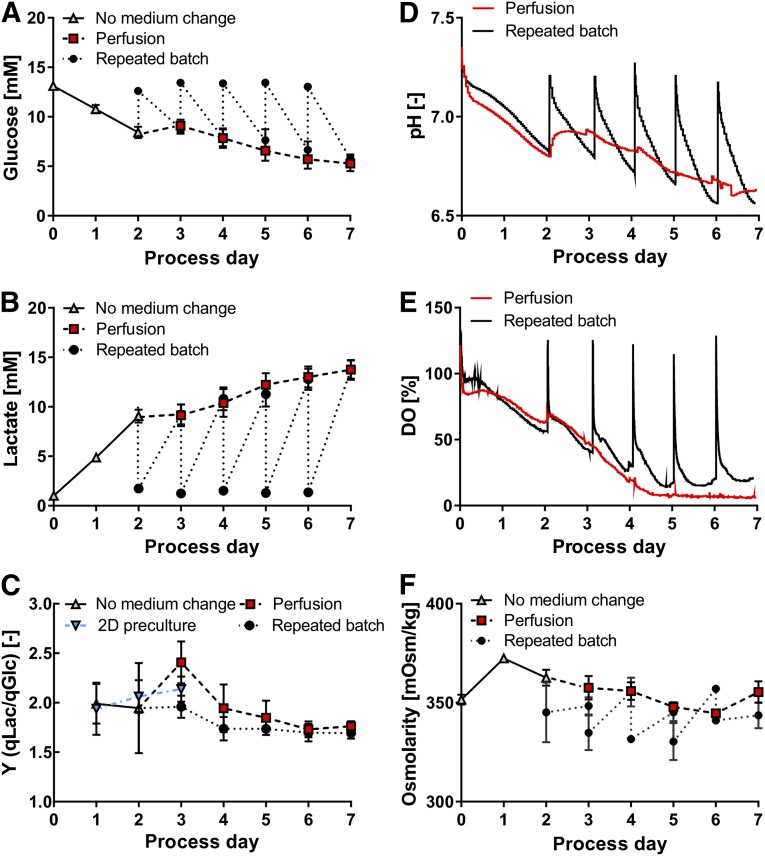
Metabolic activity of hCBiPS2 cells in repeated batch and perfusion cultures. Perfusion was initiated after 48 hours of culture. In parallel entire medium was replaced daily from day 2 onward in repeated batch cultures, keeping the daily and overall medium throughput equal. (A, B): Feeding strategies result in respective concentration pattern for glucose (A) and lactate (B) (both n = 4). (C): The specific yield coefficient of lactate from glucose Y(qLac/qGlc) is highest in the earlier process phase and decreases for both feeding strategies from process day 4 onward. (D–F): In response to repeated batch, heterogeneous “zigzag-like” patterns for pH (D) and dissolved oxygen (DO) (E) as well as culture osmolarity (n = 3) (F) in contrast to homogeneous progression at perfusion were observed. To ensure clarity of illustration, pH levels and dissolved oxygen are depicted for one bioreactor run of each feeding strategy. Samples for glucose, lactate, and osmolarity analysis were taken every 24 hours of culture and additionally after medium exchange for repeated batch cultures.

