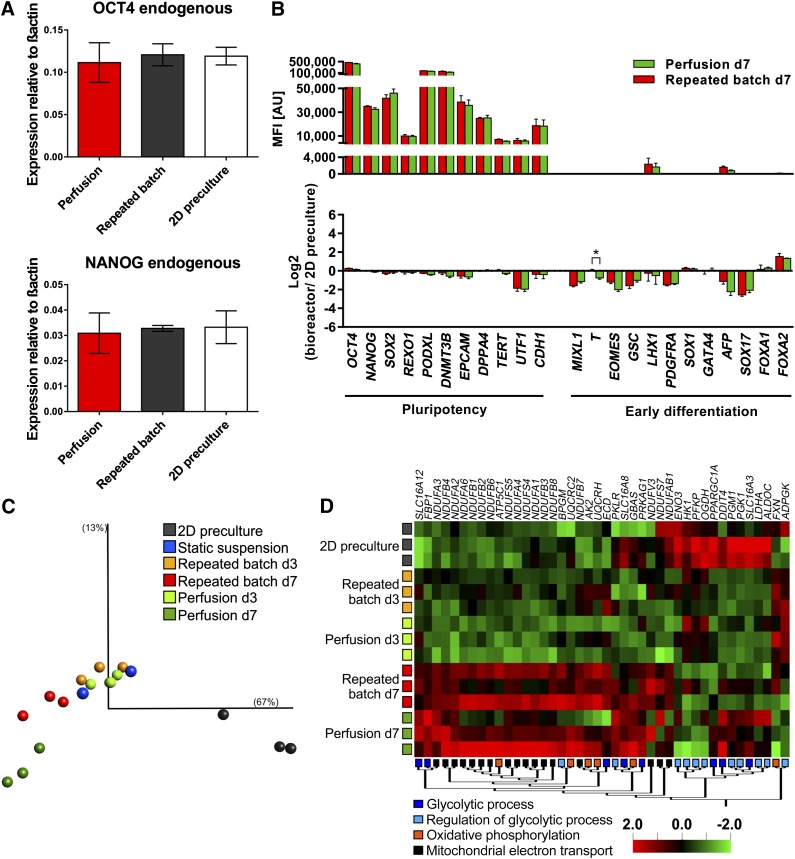
Figure 6.
Expression analysis revealed high similarity between hCBiPS2 cells from 2D precultures and 3D suspension culture. (A): Quantitative real-time analysis for transcription factors OCT4 and NANOG showed no significant deviation in expression levels of expanded cells either under repeated batch or under perfusion conditions and furthermore compared with 2D precultures (n = 3). Primers were defined to detect endogenous variant of the factor to exclude false positive results in induced pluripotent stem cells. (B): Expression levels of genes associated with pluripotency and early differentiation for repeated batch and perfusion-based cultures displayed as absolute processed fluorescence intensity (top) and compared with 2D precultures (bottom, n = 3). (C): Principle component analysis on global gene expression of hiPSC 2D precultures on day 3 (gray), static suspension cultures on day 3 (blue), dynamic suspension cultures with either perfusion or repeated batch on day 3 (perfusion, light green; repeated batch, orange), or process endpoint day 7 (perfusion, dark green; repeated batch, red). Visualization comprises >100 genes with σ/σmax < 0.255 and p < .001 in a group comparison. See also supplemental online Figure 4A for details of the experimental setup. (D): The hierarchically clustered heat map displays differentially expressed genes between 2D precultures, repeated batch (day 3 and day 7), and perfusion (day 3 and day 7) samples of genes allocated to the GO categories “glycolytic process,” “regulation of glycolytic process,” “oxidative phosphorylation,” and “mitochondrial electron transport” (multigroup comparison; p < .1). The microarray dataset presented in this figure was deposited in Array Express with accession no. E-MTAB-3898 (http://www.ebi.ac.uk/arrayexpress/experiments/E-MTAB-3898). Abbreviation: d, day.

