Figure 7.
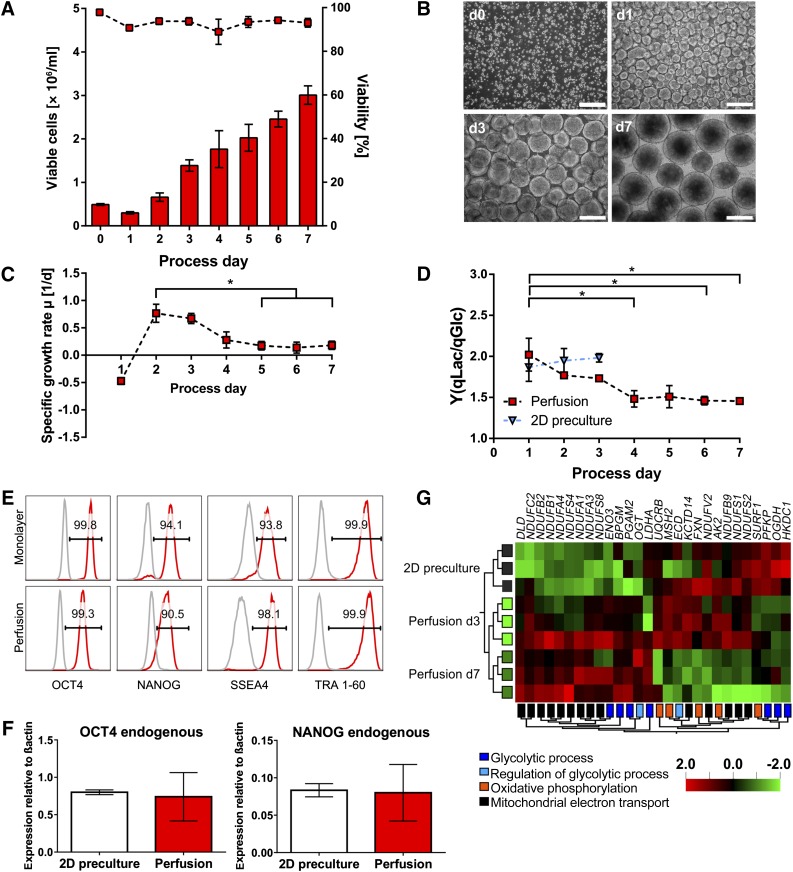
Characterization of perfusion cultures using hHSC_F1285T_iPS2 cells confirmed the robustness of the expansion process. (A): An average viable cell density of 3.01 × 10⁶ cells per milliliter was obtained in 7-day lasting perfusion cultures representing an approximately sixfold hPSC expansion. Cell densities (columns) and viability (symbols) were determined daily (n = 3). (B): Representative microscopic images of aggregate formation and progression (scale bars = 200 µm). (C, D): Specific growth rate (C) and yield coefficient of lactate from glucose Y(qLac/qGlc) (D) were highest in earlier process phase for the independent second cell line as well (both n = 3). Results are reported as mean ± SEM. Differences were considered statistically significant at ∗, p < .05. (E): Flow cytometry analysis revealed that the majority of cells harvested on day 7 were positive for pluripotency markers OCT4, NANOG, SSEA4, and TRA 1-60 (red; isotype in gray). (F): Quantitative real-time analysis for pluripotency transcription factors OCT4 and NANOG revealed no significant deviation in expression levels for cells harvested on day 7 compared with 2D monolayer precultures (n = 3). Primers were defined to detect endogenous variant of the gene only. (G): Hierarchically clustered heatmap displaying differentially expressed genes between 2D preculture and perfusion (day 3 and day 7) samples allocated to the GO categories “glycolytic process,” “regulation of glycolytic process,” “oxidative phosphorylation,” and “mitochondrial electron transport” (multigroup comparison: p < .1). The microarray dataset presented in this figure was deposited in Array Express with accession no. E-MTAB-4149 (http://www.ebi.ac.uk/arrayexpress/experiments/E-MTAB-4149). Abbreviation: d, day.

