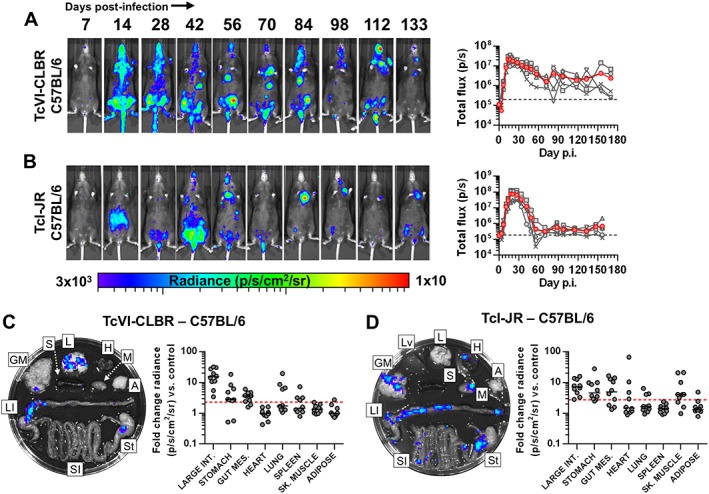
Figure 4.

T. cruzi TcI‐JR and TcVI‐CLBR have similar infection dynamics in C57BL/6 mice including chronic gut persistence. A, B. Course of T. cruzi TcVI‐CLBR (n = 10) (A) and TcI‐JR (n = 10) (B) infection in C57BL/6 mice tracked by in vivo bioluminescence imaging. Panels show serial ventral images of one mouse. Log‐scale pseudocolour heat‐maps show intensity of bioluminescence; minimum and maximum radiances are indicated. Charts show total bioluminescence for five individual mice (grey) and their mean (red) from the experiments represented by adjacent images. Dashed line indicates detection threshold. C, D. Quantification of tissue‐specific chronic parasite densities in TcVI‐CLBR (n = 10, 170–175 dpi) (C) and TcI‐JR (n = 10, 156–158 dpi) (D) infected C57BL/6 mice using ex vivo bioluminescence imaging. Images show bioluminescence intensities for a representative mouse: Adipose (A), gut mesenteric tissue (GM), heart (H), lung (L), large intestine (LI), liver (Lv), skeletal muscle (M), spleen (S), small intestine (SI) and stomach (St). Charts show quantification of tissue‐specific infection intensities expressed as fold change in bioluminescence versus matching tissues from uninfected controls. Black lines show median values and red dashed lines indicate detection threshold. Data are from two independent experiments.
