
Figure 3.
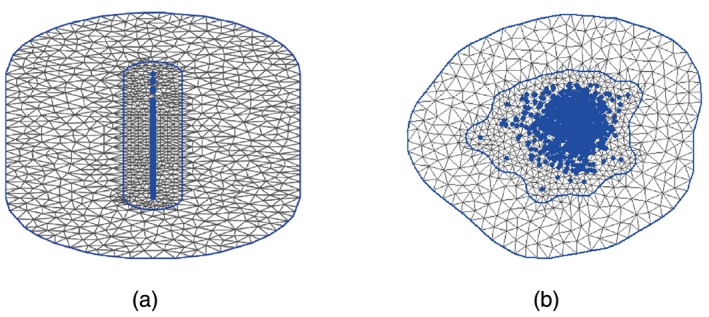
Two grid approximations for the same data set. The LHS shows the triangulation when the variables are left on their original scale, with the projected data points in blue. Notice that there are a large number of triangles in this case, but a relatively small number that surround the data points. In contrast to this, on the right, where the data points are scaled we note that a much larger number of mesh points cover the data, allowing for a more accurate Matérn field approximation for a fixed computational time.