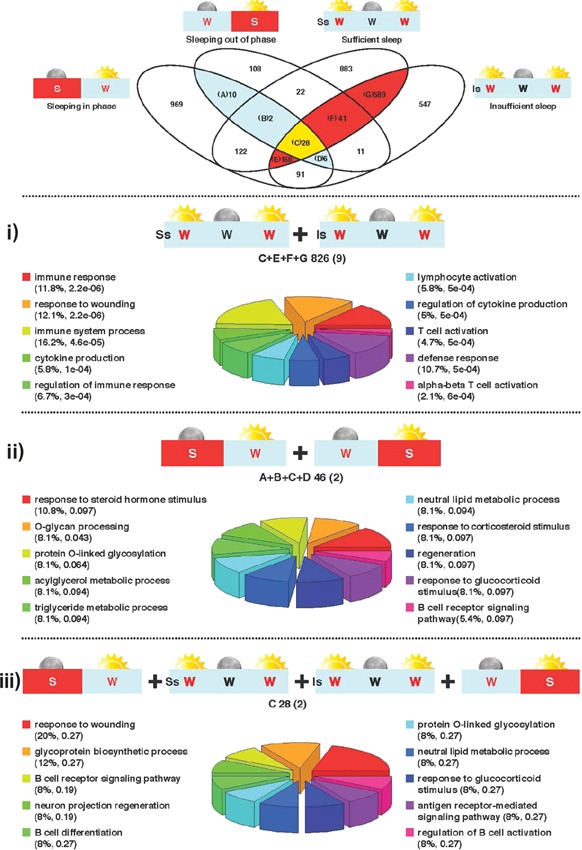
Figure 2.

Venn diagram depicting the overlap of the lists of genes with a circadian expression profile obtained from analysis of gene expression profiles in each of the four sleep conditions tested using our previously reported algorithm 2, 7. Orange plus yellow highlighted area indicates genes that are identified as having a circadian expression profile during 40 hours of wakefulness with and without sufficient sleep. Blue and yellow highlighted area indicates genes that are identified as having a circadian expression profile when sleeping in and out of phase with melatonin. Yellow area indicates genes that are found to have a circadian expression profile across all conditions we have tested in humans, i–iii. Top‐ten biological processes associated with the circadian genes identified in each comparison listed above, respectively. Letters indicate which segments of the Venn contributed to the comparison. The total number of circadian genes identified is given together with the number of rhythmic core clock genes (in brackets). The % enrichment for each process is listed together with the p‐value. The colour‐coded pie chart segments also represent the % enrichment for each process.
