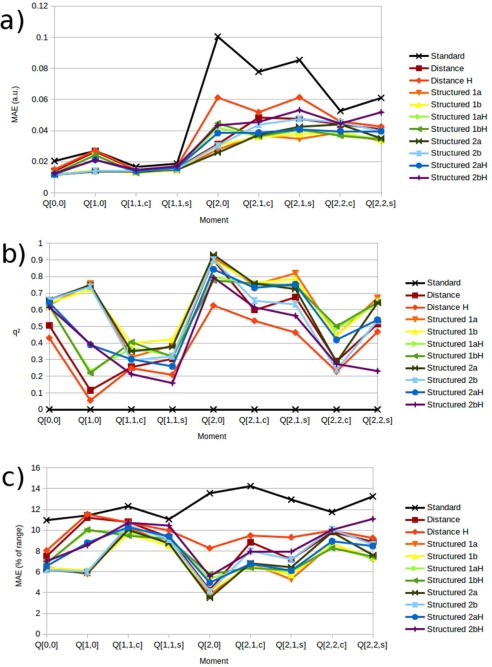
Figure 10.

Validation results of oxygen multipole moment kriging models showing a) mean absolute error, b) q 2 values, and c) mean absolute errors as a percentage of the range of predictions. [Color figure can be viewed in the online issue, which is available at wileyonlinelibrary.com.]
