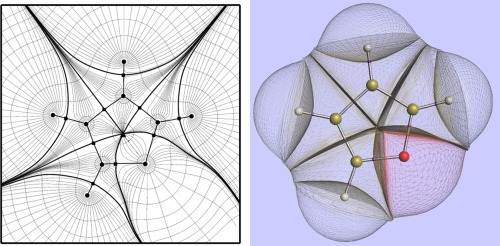
Figure 1.

(left) A contour plot of the electron density of in molecular plane of furan superimposed onto a representative collection of gradient paths. Atoms are represented by black circles, where the gradient paths terminate. Interatomic surfaces are highlighted as solid curves, and contain bond critical points (black squares). A ring critical point (triangle) is also shown in the center of the furan. (right) A 3D representation of the topological atoms in furan, in the same orientation as the left panel. The molecule is capped by the ρ = 0.0001 au envelope and the bond critical points are marked in purple.
