
Figure 4.
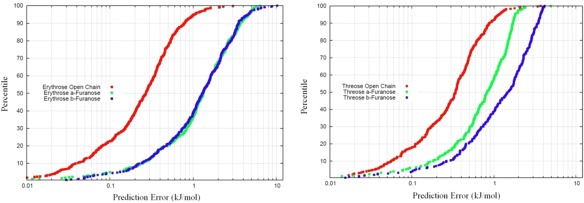
S‐curves corresponding to all erythrose (left) and threose (right) systems studied. The open chain forms are systematically better predicted than the corresponding furanose forms. [Color figure can be viewed in the online issue, which is available at wileyonlinelibrary.com.]