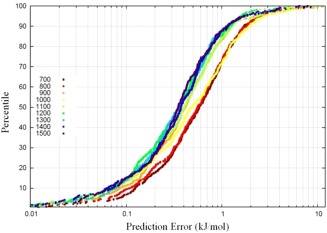
Figure 5.

S‐curves for erythrose open chain at various training set sizes. Note the progression of the S‐curves towards the lower prediction errors as the training set size increases. However, owing to the logarithmic abscissa, this does not correspond to a uniform enhancement of a kriging model given a consistently larger training set size. [Color figure can be viewed in the online issue, which is available at wileyonlinelibrary.com.]
