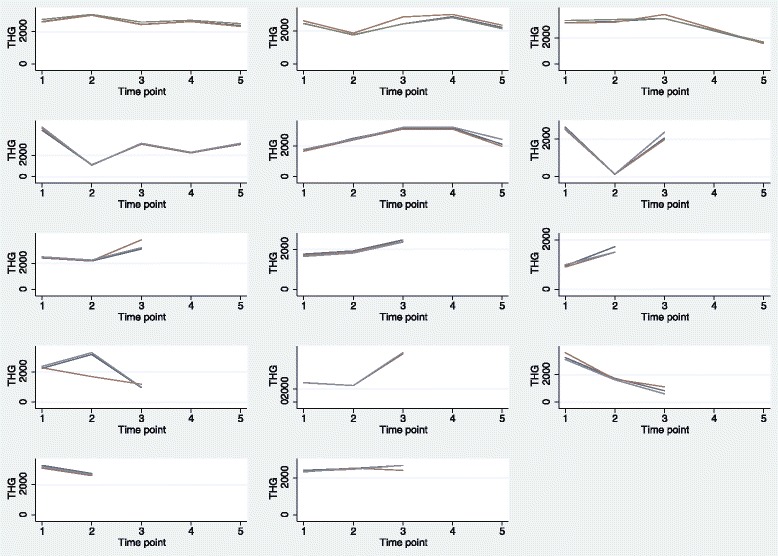
Fig. 3.

Line plots for study 2 by patient and observer. Display of individual measurements over time by patient (N = 14), indicating the three observers by different colours. The first row consists of plots for patients 1 to 3, the second row for patients 4 to 6 and so on. Note that the scan for patient 3 at time point 4 was unavailable due to a technical error.
