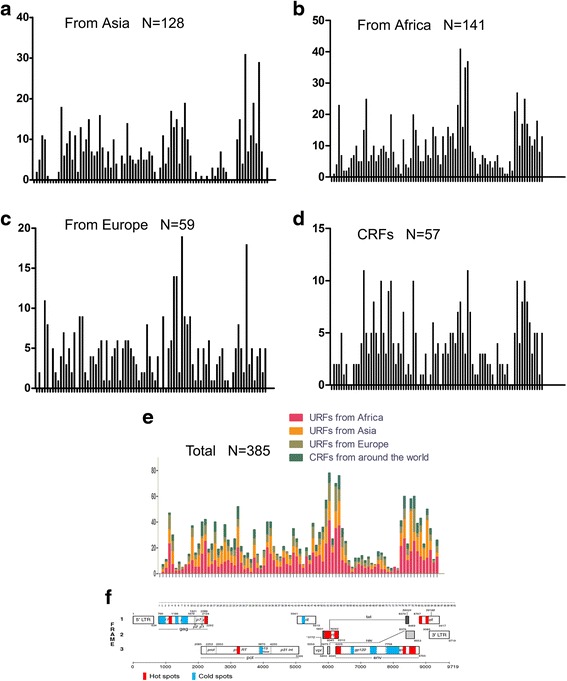
Fig. 1.

Breakpoint frequency in near full-length URF and CRF groups. a The breakpoint distribution of URFs from Asia. b The breakpoint distribution of URFs from Africa. c The breakpoint distribution of URFs from Europe. d The breakpoint distribution of global CRFs. e The integrated distribution of the 4 groups. f The hot regions and cold regions and corresponding gene locations. The breakpoint positions are based on the HXB2 numbering (from HXB2 790 nt to 9417 nt). Horizontal blue lines: average frequency value per window; horizontal red lines: hot spot boundary line; horizontal black lines: cold spot boundary line. Frequency scales are some different in each panel for better resolution
