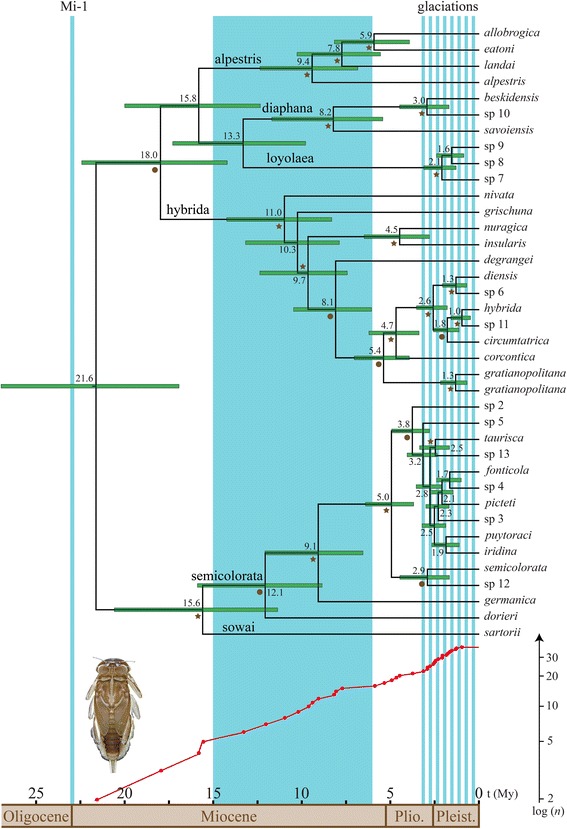
Fig. 3.

Ultrametric mitochondrial concatenated (cox1 + 16S) phylogeny (top) obtained using a relaxed lognormal molecular clock and a standard insect mutation rate of 0.0115 substitution/site/My in BEAST, and the corresponding LTT plot of the empirical data (bottom), with vertical axis (number of GMYC species) in logarithmic scale. For each node, estimated ages (horizontal axis, time before present in My) are given. Horizontal green bars indicate the 95 % highest posterior density interval. Stars indicate lineages that were constrained to be monophyletic according to the mt + nuc concatenated phylogeny (i.e. PP > 0.95 and BS > 80; see Fig. 2 and Additional file 4: Figure S3); circles indicate PP > 0.9. The blue zone represents a period of global climatic cooling trend, empty zones warming trends, following Zachos et al. [109]. Blue vertical bars symbolize the Oligocene/Miocene boundary glacial maximum (Mi-1; 23 Mya) and the Quaternary glacial cycles (glaciations; 3.2 Mya to present). Species groups are specified above corresponding branches
