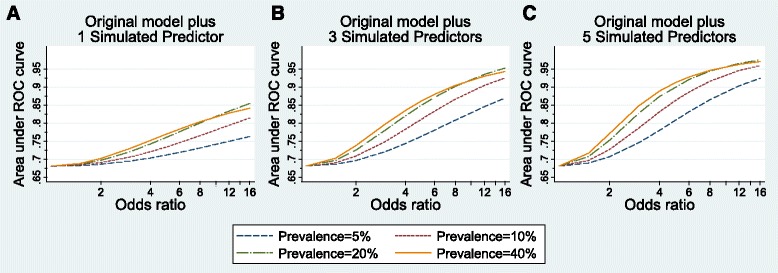
Fig. 1.

Discrimination performance (measured by area under Receiver Operator Characteristic curve) of risk prediction models according to simulated predictor characteristics. The original risk prediction model was augmented with simulated predictors with prevalence from 5 to 40 % and odds ratios ranging from 1 to 16: a one added simulated predictor per model; b three added simulated predictors per model; c five added simulated predictors per model
