Fig. 3.

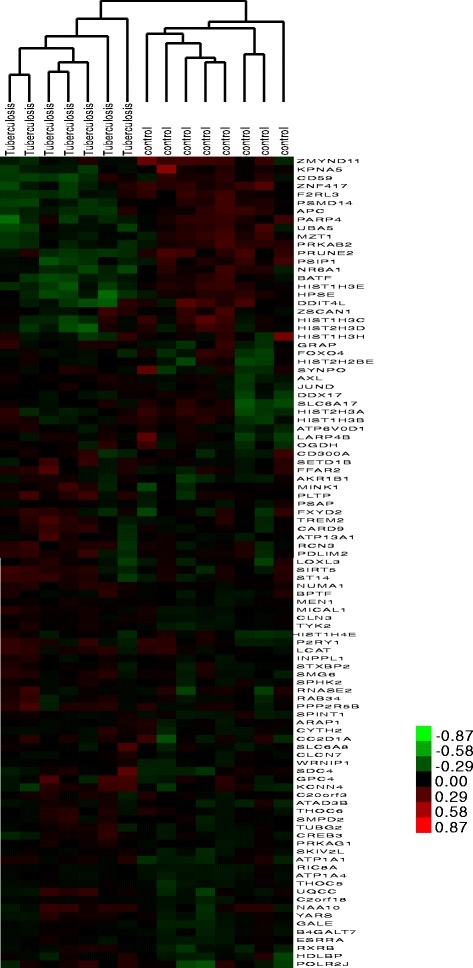
Clustering analysis of the important genes. The above dendrogram shows clustering of the samples. The red color stands for up-regulated genes, while green color stands for down-regulated genes

Clustering analysis of the important genes. The above dendrogram shows clustering of the samples. The red color stands for up-regulated genes, while green color stands for down-regulated genes