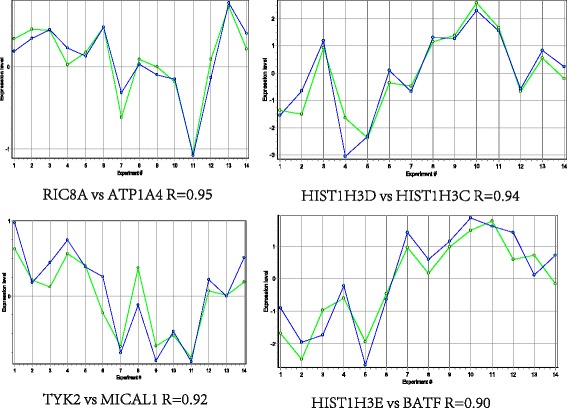
Fig. 4.

The expression levels of top 4 gene pairs. The x-coordinate represents samples; y-coordinate represents gene expression values. The blue lines represent RIC8 guanine nucleotide exchange factor A (RIC8A), histone cluster 2, H3d (HIST2H3D), tyrosine kinase 2 (TYK2) and histone cluster 1, H3e (HIST1H3E), respectively. The green lines represent ATPase, Na+/K+ transporting, alpha 4 polypeptide (ATP1A4), histone cluster 1, H3c (HIST1H3C), microtubule associated monooxygenase, calponin LIM domain containing 1 (MICAL1) and basic leucine zipper transcription factor, ATF-like (BATF), respectively. R stands for Pearson correlation coefficient
