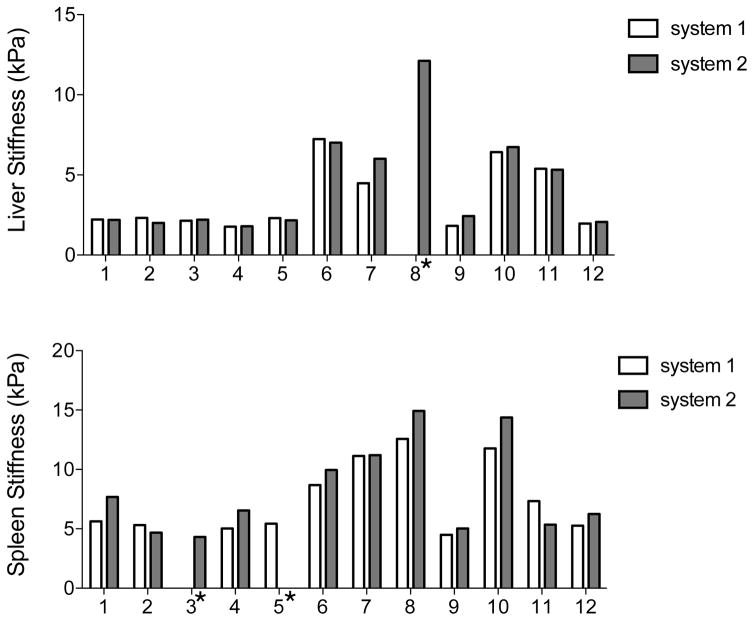
Fig. 3.
Histogram distribution plot showing LS and SS values in each subject measured by 2 observers with 2 MR platforms (average of 2 observers). There were one case of MRE failure for the liver and 2 cases for the spleen. In 8/10 subjects, spleen stiffness was lower with system #1; while liver stiffness was lower with system #1 in 6/11 subjects.

