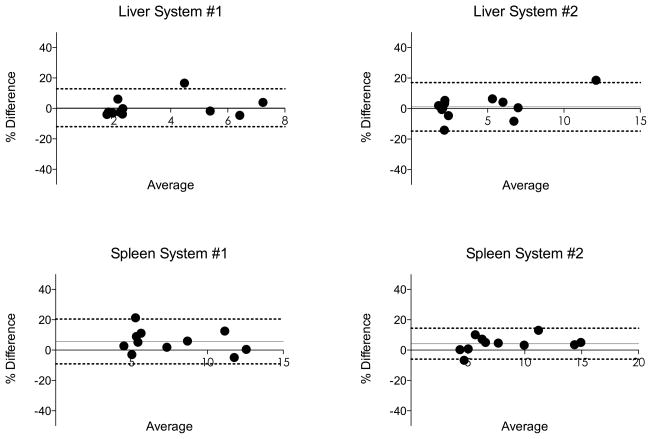
Fig. 5.
Bland-Altman analysis for inter-observer reproducibility of liver and spleen stiffness obtained with two different platforms (System #1: 3.0T GE Discovery MR750, System #2: 1.5T Siemens MAGNETOM Aera). Dashed lines represent Bland-Altman limits of agreement (1.96 SD). Grey line represents bias (see also Table 4). The inter-observer reproducibility was excellent with low bias (<6%) and low CR (<16%).

