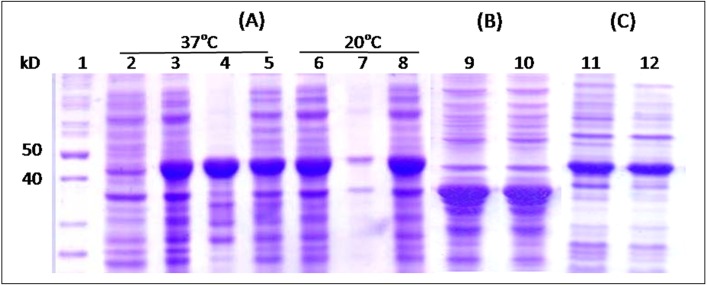
Fig 2. SDS PAGE analysis.
Total, soluble and insoluble proteins of E. coli cells expressing His-HSPX-tnPstS1 (A), His-HSPX-PE35 (B) and His-HSPX-fbpC1 (C). 1- Protein size markers; 2- Uninduced cells; 3, 6, 9, 11- total cell proteins; 4, 7- insoluble fraction after cell lysis; 5, 8, 10, 12- soluble fraction of the cell lysate.

