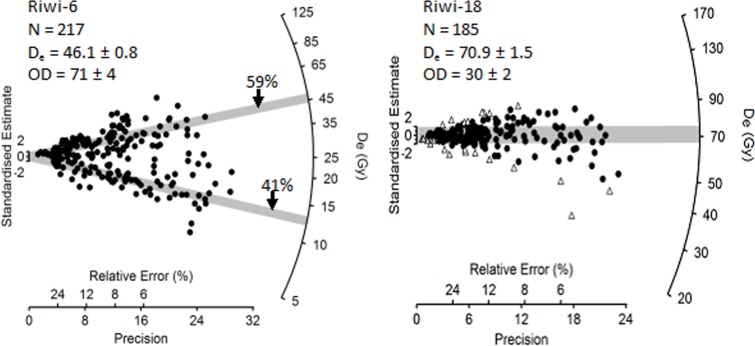
Fig 5.
Radial plot of the De distribution for the accepted grains in a (A) mixed (Riwi-6) and a (B) scattered (Riwi-18) sample. The grey bands in (A) are centred on the weighted mean De determined for each dose population using the Finite Mixture Model. The grey band in (B) is centred on the weighted mean De determined using the central age model after the rejection of outliers (shown as open triangles). Radial plots for all 37 samples are presented in S1 Fig.

