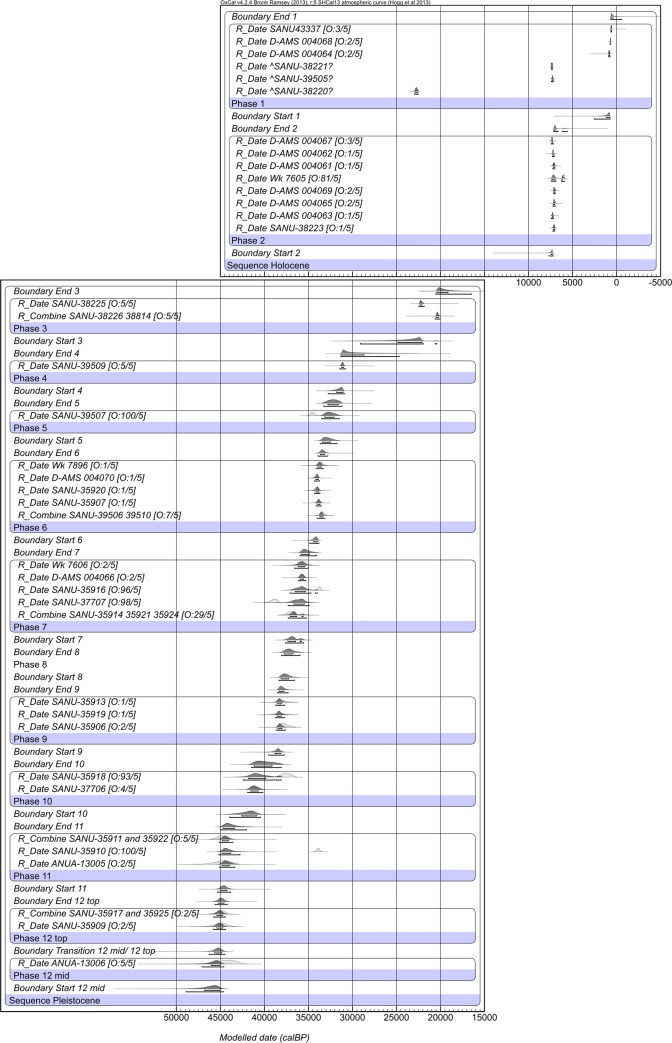
Fig 6. Bayesian model of the radiocarbon dates from Riwi.
Dates have been calibrated against SHCal13 [30] and modelled in OxCal v.4.2 [31]. Pale probability distributions represent the calibrated, unmodelled date, whilst dark grey distributions represent the modelled date. The two brackets beneath the distributions represent the 68.2% and 95.4% probability ranges. Prior and posterior outlier probabilities are given in brackets following the sample name in the form [O: posterior/prior]. A ‘?’ implies the date was not included in the model.

