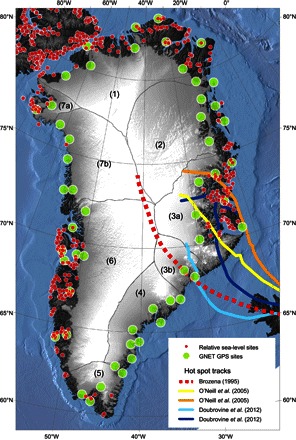
Fig. 1. Location map.

Locations of the GNET GPS stations (red dots) and RSL observations (green dots). Black curves denote the major drainage basins numbered from 1 to 7; drainage 3 is separated into subbasins 3A and 3B (inset), the latter representing the near field of the KUAQ glacier. The yellow curve shows a reconstruction of the Iceland hot spot track (57, 58). Bathymetry is shown over the ocean and surface elevation over the land/ice (25).
