. 2016 Sep 8;5:e16432. doi: 10.7554/eLife.16432

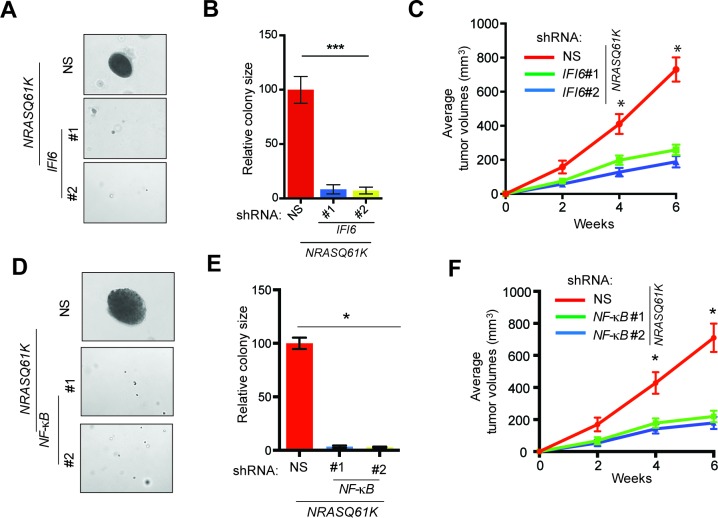
Figure 2. IFI6 is necessary for NRASQ61K-induced melanocyte transformation.

(A) MEL-ST/NRASQ61K cells expressing IFI6 or non-specific (NS) shRNA were analyzed for colony-forming potential using a soft agar assay. Representative images are shown. (B) Relative colony size for the soft-agar assay presented in panel A is shown. (C) MEL-ST/NRASQ61K cells expressing IFI6 or non-specific (NS) shRNA were injected subcutaneously into the flanks of athymic nude mice. Average tumor volumes (n = 5) for MEL-ST/NRASQ61K cells expressing NS or IFI6 shRNA are shown at the indicated time points. (D). MEL-ST/NRASQ61K cells expressing NS or NF-κB shRNA were analyzed for colony-forming potential using a soft agar assay. Representative images are shown. (E) Relative colony size for the soft-agar assay presented in panel D is shown. (F) MEL-ST/NRASQ61K cells expressing NS or NF-κB shRNA were injected subcutaneously into the flanks of athymic nude mice. Average tumor volumes (n = 5) for MEL-ST/NRASQ61K cells expressing NS or NF-κB shRNA are shown at the indicated time points. In all panels, data are presented as mean ± SEM, and *p<0.05 and ***p<0.0005.

DOI: http://dx.doi.org/10.7554/eLife.16432.009

Figure 2.

Figure 2—figure supplement 1. Monitoring expression of IFI6 and E2F2 proteins following IFI6 knockdown.

Figure 2—figure supplement 1.

Indicated cell lines expressing non-specific (NS) or IFI6 shRNA were analyzed for IFI6, E2F2, and ACTINB protein expression by immunoblotting.
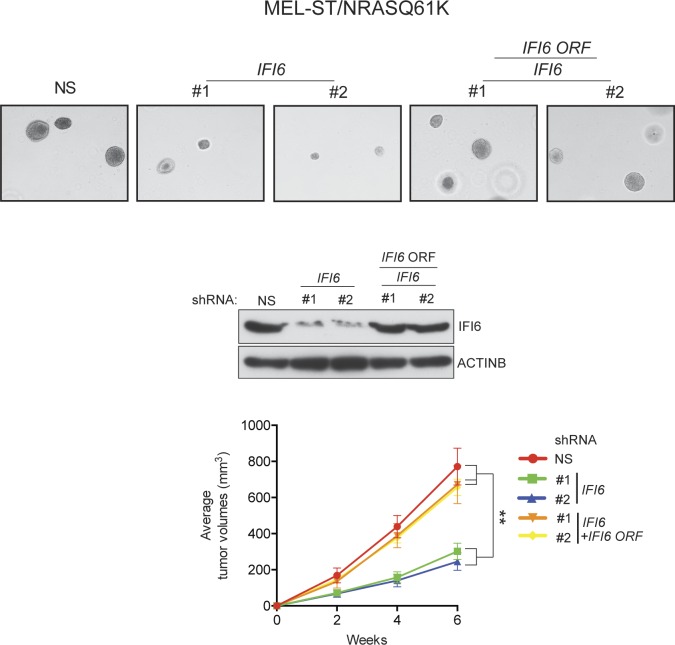
Figure 2—figure supplement 2. Ectopic expression of shRNA-resistant IFI6 ORF rescues tumor growth in MEL-ST/NRASQ61K cells expressing IFI6 shRNA.

Figure 2—figure supplement 2.

(Top panel) Anchorage-independent growth in soft agar was evaluated using MEL-ST/NRASQ61K cells expressing non-specific (NS) shRNA or IFI6 shRNA with or without the shRNA-resistant IFI6 open reading frame (ORF). Representative images under the indicated conditions are shown. (Middle Panel) MEL-ST/NRASQ61K cells expressing the indicated constructs were analyzed for relative protein levels of IFI6 or ACTINB by immunoblotting. (Bottom Panel) MEL-ST/NRASQ61K cells expressing the indicated constructs were injected subcutaneously into athymic nude mice. Average tumor volumes (n = 8) under the indicated conditions are shown at indicated times. Data are presented as mean ± SEM; **p<0.005.