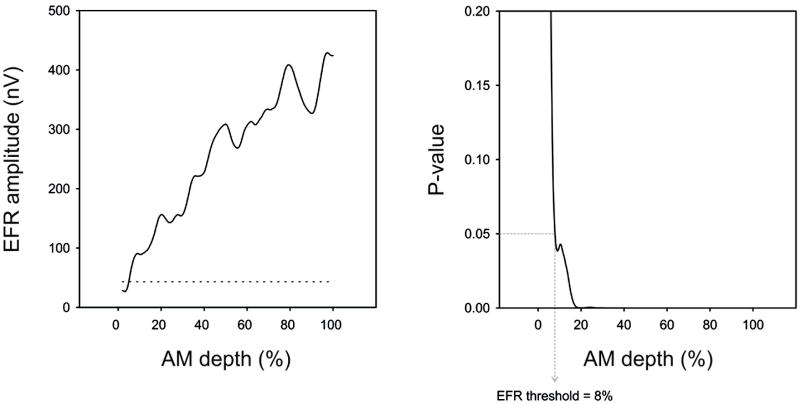
Figure 3.
EFR amplitude (left panel) and P-value (right panel) as a function of AM depth is shown for a sample subject. The noise floor of the EEG recording is shown as a horizontal dashed line on the left panel. Determination of EFR threshold was based on the lowest %AM depth where the EFR was significantly different from the background noise (p<0.05). On the right panel, the dotted line indicates the lowest %AM depth where the EFR was significant (p=0.05). In this case, the EFR threshold was 8%. In this subject, the behavioral threshold for AM detection was also at 8%.

