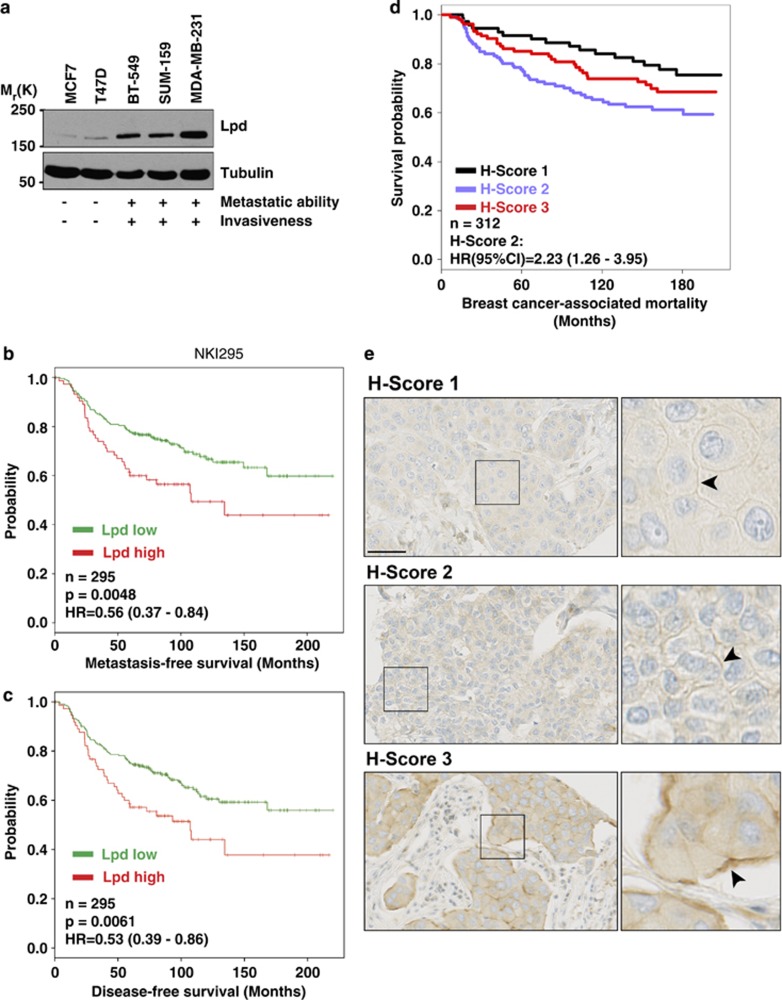
Figure 1.
Increased Lpd expression correlates with poor prognosis for breast cancer patients. (a) Western blot analysis of Lpd expression in human breast cancer cell lines with varying metastatic potential. Loading control: Tubulin. (b) Kaplan–Meier analysis of metastasis-free survival in the NKI295 data set. Patients were stratified by expression of Lpd. The P-value was calculated by a log-rank test. (c) Kaplan–Meier analysis of disease-free survival in the NKI295 data set. Patients were stratified by expression of Lpd. The P-value was calculated by a log-rank test. (d) Kaplan–Meier plots of breast cancer-associated mortality of histoscores 1–3 for Lpd intensity at the plasma membrane. Histoscore 2: HR (95% CI): 2.23 (1.26–3.95). (e) Representative examples of Lpd immunohistochemistry staining for histoscores 1–3 for Lpd staining intensity at the plasma membrane. Scale bar, 5 μm. See also Supplementary Figures S1 and S2.

