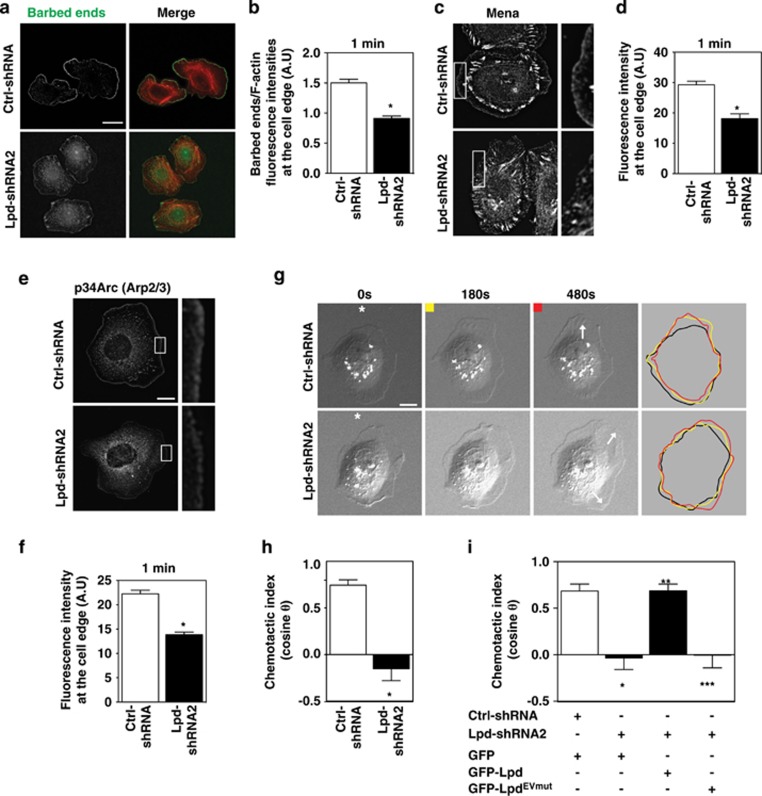
Figure 4.
Lpd is required for chemosensing. (a) Barbed-end incorporation after 5 nM EGF stimulation in Ctrl-shRNA- and Lpd-shRNA2-MTLn3 cells. Fixed cells expressing rhodamine-labeled actin were co-stained with phalloidin. Scale bar, 20 μm. (b) Relative number of barbed-ends incorporation at the lamellipodium edge at 1 min after 5 nM EGF stimulation; over 60 cells analyzed. (n=3). Data are represented as mean±s.e.m. Unpaired t-test; *P⩽0.05. (c) Mena immunofluorescence in Ctrl-shRNA and Lpd-shRNA2 MTLn3 cells. Cells were stimulated for 1 min with 5 nM EGF. Insets show enlarged image of Mena staining. Scale bar, 10 μm. (d) Quantification of data shown in (c); mean fluorescence intensity of Mena at the lamellipodium edge (within 0.66 μm of leading edge); over 45 cells analyzed. (n=3). Data are represented as mean±s.e.m. Unpaired t-test; *P⩽0.05. (e) p34Arc immunofluorescence in Ctrl-shRNA- and Lpd-shRNA2-MTLn3 cells, 1 min after 5 nM EGF stimulation. Insets show enlarged image of p34Arc staining. Scale bar, 10 μm. (f) Quantification of data shown in (e); mean fluorescence intensity of p34Arc at the lamellipodium edge (within 0.66 μm of the leading edge); over 45 cells analyzed. (n=3). Data are represented as mean±s.e.m. Unpaired t-test; *P⩽0.05. (g) Representative micrographs from time-lapse movies of Ctrl-shRNA- and Lpd-shRNA2-MTLn3 cells stimulated with an EGF-filled micropipette (position indicated by asterisk). White arrows on the 480-s frames indicate the directions of protrusion overtime. Scale bar, 10 μm. Colored lines indicate cell contour. (h) Quantification of chemotactic index of Ctrl-shRNA- and Lpd-shRNA2-MTLn3 cells. Over 25 cells analyzed from at least three independent experiments. Data are represented as mean±s.e.m. Unpaired t-test; *P⩽0.05. (i) Quantification of chemotactic index of Ctrl-shRNA MTLn3 cells transfected with GFP-vector (n=13 cells); and Lpd-shRNA2 MTLn3 cells transfected with either GFP-vector (n=22 cells), GFP-Lpd (n=17 cells) or GFP-LpdEVmut (n=17 cells). Data are represented as mean±s.e.m. One-way ANOVA; Bonferroni's test; *P⩽0.05 vs Ctrl-shRNA+GFP; **P⩽0.05 vs Lpd-shRNA2+GFP; ***P⩽0.05 vs Lpd-shRNA2+GFP-Lpd. The difference between Lpd-shRNA2+GFP and Lpd-shRNA2+GFP-LpdEVmut was not significant. See also Supplementary Figures S4 and S5.

