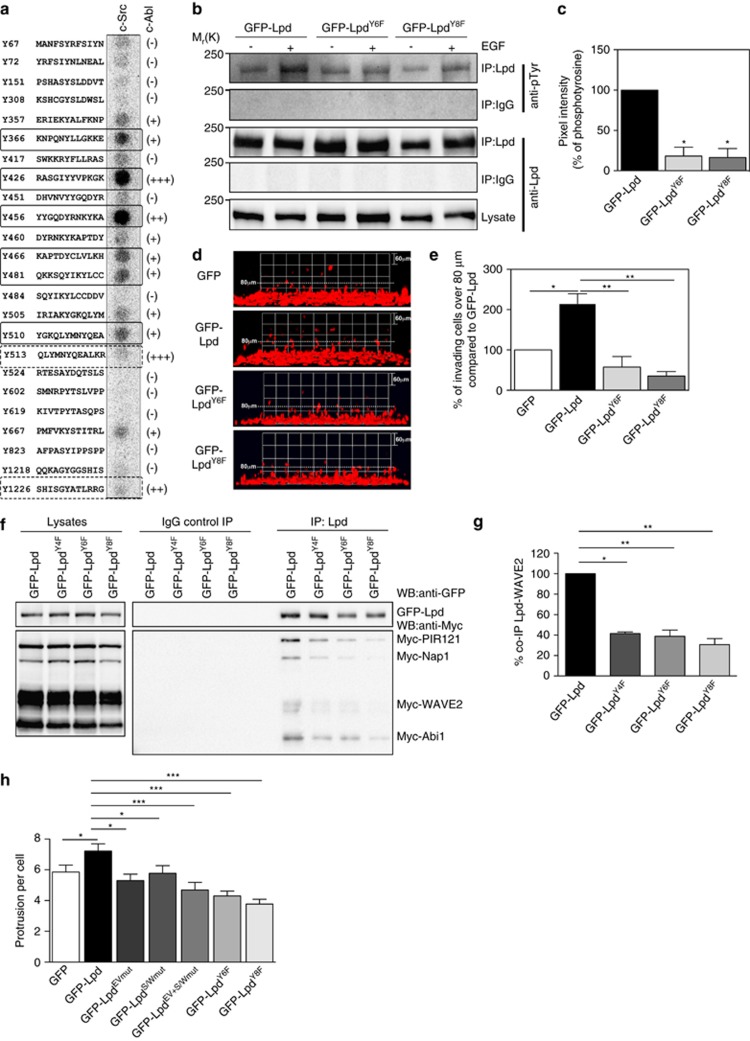
Figure 7.
Phosphorylation of Lpd by c-Src and c-Abl is required for cancer cell invasion. (a) Peptides harboring all the tyrosine residues in Lpd were directly synthesized onto a membrane. An in vitro kinase assay was performed: the membranes were incubated with purified c-Src kinase and γ-32P-ATP. Phosphorylation was detected using a phosphorimager and visualized as high intensity spots. Increasing levels of c-Abl phosphorylation of respective peptides as identified by Michael et al.19 are indicated by (+), (++), (+++) and (−) for not phosphorylated. Straight rectangles represent the common phosphorylation sites for both c-Src and c-Abl, and dotted rectangles represent c-Abl specific phosphorylation sites.19 (b) HeLa cells were transfected with GFP-LpdY6F, GFP-LpdY8F or GFP-Lpd as a control. HeLa cells were serum starved overnight and stimulated with 100 ng/ml EGF for 5 min. Immunoprecipitation was performed from cell lysates using Lpd-specific antibodies or rabbit IgG as a control followed by western blotting with anti-Lpd and anti-phosphotyrosine (pTyr) antibodies. (c) Quantified band intensities of chemiluminescence blots (b) of GFP-Lpd, GFP-Lpd phospho-mutants and pTyr imaged with a CCD camera. pTyr normalized against the immunoprecipitated Lpd. Baseline phosphorylation in the absence of EGF was subtracted from the corresponding EGF+ samples. n=6, data are represented as mean±s.e.m. One-way ANOVA; Dunnett's; *P⩽0.0001. (d, e) Inverted invasion assays were performed using MDA-MB-231 breast cancer cells stably expressing mCherry-H2B (labeling the nucleus) transfected with GFP-Lpd, GFP-LpdY6F, GFP-LpdY8F or GFP empty vector as a control. The nuclei of the cells were visualized using confocal microscopy. (d) The image stacks were processed by Volocity software to make a 3D reconstruction. (e) Quantification of the number of nuclei of invading cells above 80 μm. n=6 (with approximately 4000 cells per experiment). Data are represented as mean±s.e.m. One-way ANOVA; Dunnett's; *P⩽0.001, **P⩽0.0001. Error bars represent s.e.m. (f) HEK293FT cells were transfected with GFP-Lpd, GFP-LpdY4F, GFP-LpdY6F, GFP-LpdY8F and Myc-tagged components of the Scar/WAVE complex. Immunoprecipitation was performed from cell lysates using GFP-specific antibody or rabbit IgG as a control followed by western blotting with anti-GFP, anti-Myc and anti-phosphotyrosine (pTyr) antibodies. (g) Quantified band intensities of chemiluminescence blots (f) of GFP-Lpd and Myc-tagged components of the Scar/WAVE complex imaged with a CCD camera. Scar/WAVE2 was normalized against the immunoprecipitated Lpd. n=4, data are represented as mean±s.e.m. One-way ANOVA; Dunnett's; **P⩽0.01, ***P⩽0.001. (h) Quantification of the number of protrusion of MDA-MB-231 transfected with GFP-Lpd, GFP-LpdEVmut, GFP-LpdS/Wmut, GFP-LpdEV+S/Wmut, GFP-LpdY6F, GFP-LpdY8F or GFP empty vector as a control plated in 3D matrigel. n=35–46 cells for each mutant; from 5 experiments. Data are represented as mean±s.e.m. One-way ANOVA; Dunnett's; *P⩽0.05, ***P<0.001. See also Supplementary Figures S7 and S8.

