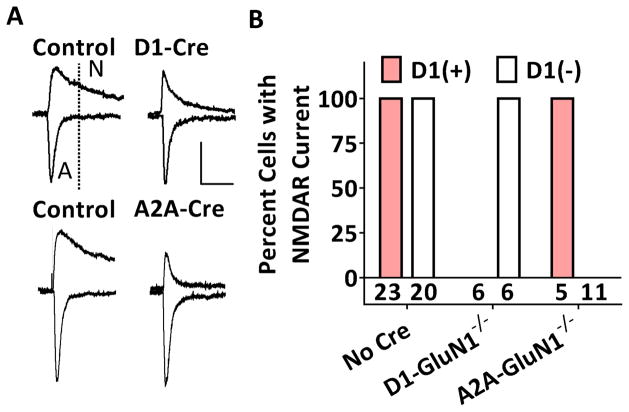
Figure 1. Selectivity of cell type-specific GluN1 deletions.
(A) Representative traces of dual component EPSCs obtained from control (left) and GluN1−/− (right) NAc core MSNs. D1(+) MSNs are displayed on the top and D1(−) MSNs on the bottom. Scale bars denote 100 pA and 50 ms. The EPSC component at 50 ms or later is mediated by NMDARs. (B) Summary graph displaying percent D1(+) (red) and D1(−) (white) neurons with measurable NMDAR currents (p < 0.001, Fisher’s exact test).

