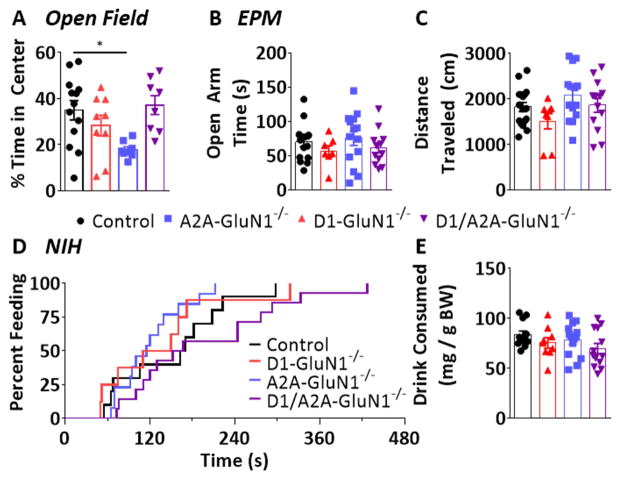
Figure 5. Anxiety-like behavior assays.
(A) Time spent in center of arena during first open field assay in control (black circles), D1-GluN1−/− (red triangles), A2A-GluN1−/− (blue squares), or D1/A2A-GluN1−/− (purple triangles) mice (different from control, *: p<0.05, Bonferroni post-test). (B) Time spent in open arms during elevated plus maze. (C) Total distance traveled during elevated maze session. (D) Cumulative distribution of latency to consume palatable drink during novelty-induced hypophagia test session. (E) Total amount of drink consumed (normalized to bodyweight) during test session.

