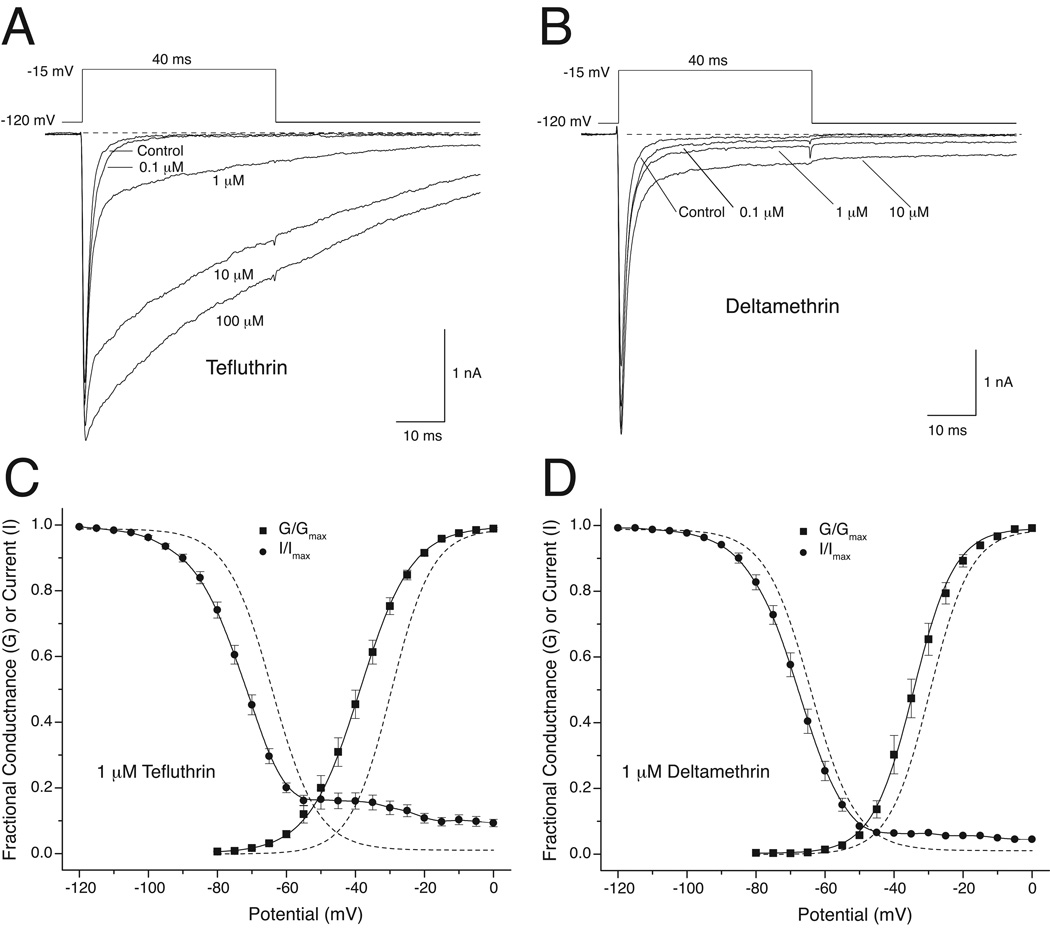
Fig. 3.
Resting-state modification by tefluthrin and deltamethrin of rat Nav1.6+β1+β2 sodium channels expressed in HEK293 cells (redrawn from data in He and Soderlund, 2011). (A) Concentration-dependent modification of sodium currents cells by tefluthrin. Traces were recorded from a single cell prior to pyrethroid exposure (control) and following equilibration with increasing concentrations of pyrethroid. Dashed lines indicate zero current. (B) Concentration-dependent modification of sodium currents by deltamethrin. Traces were recorded from a single cell prior to pyrethroid exposure (control) and following equilibration with increasing concentrations of pyrethroid. Dashed lines indicate zero current. (C) Effects of 1 µM tefluthrin on sodium window currents in HEK293 cells expressing rat Nav1.6+β1+β2 sodium channels. (D) Effects of 1 µM deltamethrin on sodium window currents in HEK293 cells expressing rat Nav1.6+β1+β2 sodium channels. Panels C and D show voltage dependence plots for activation and steady-state inactivation in the presence of 1 µM pyrethroid (He and Soderlund, 2011; He and Soderlund, 2014). Dashed lines show the activation and inactivation curves recorded from HEK293 cells expressing rat Nav1.6+β1+β2 sodium channels in the absence of pyrethroid.

